\n
## Density Plot & Marginal Distributions: Text Classification in Dimensionality Reduction Space
### Overview
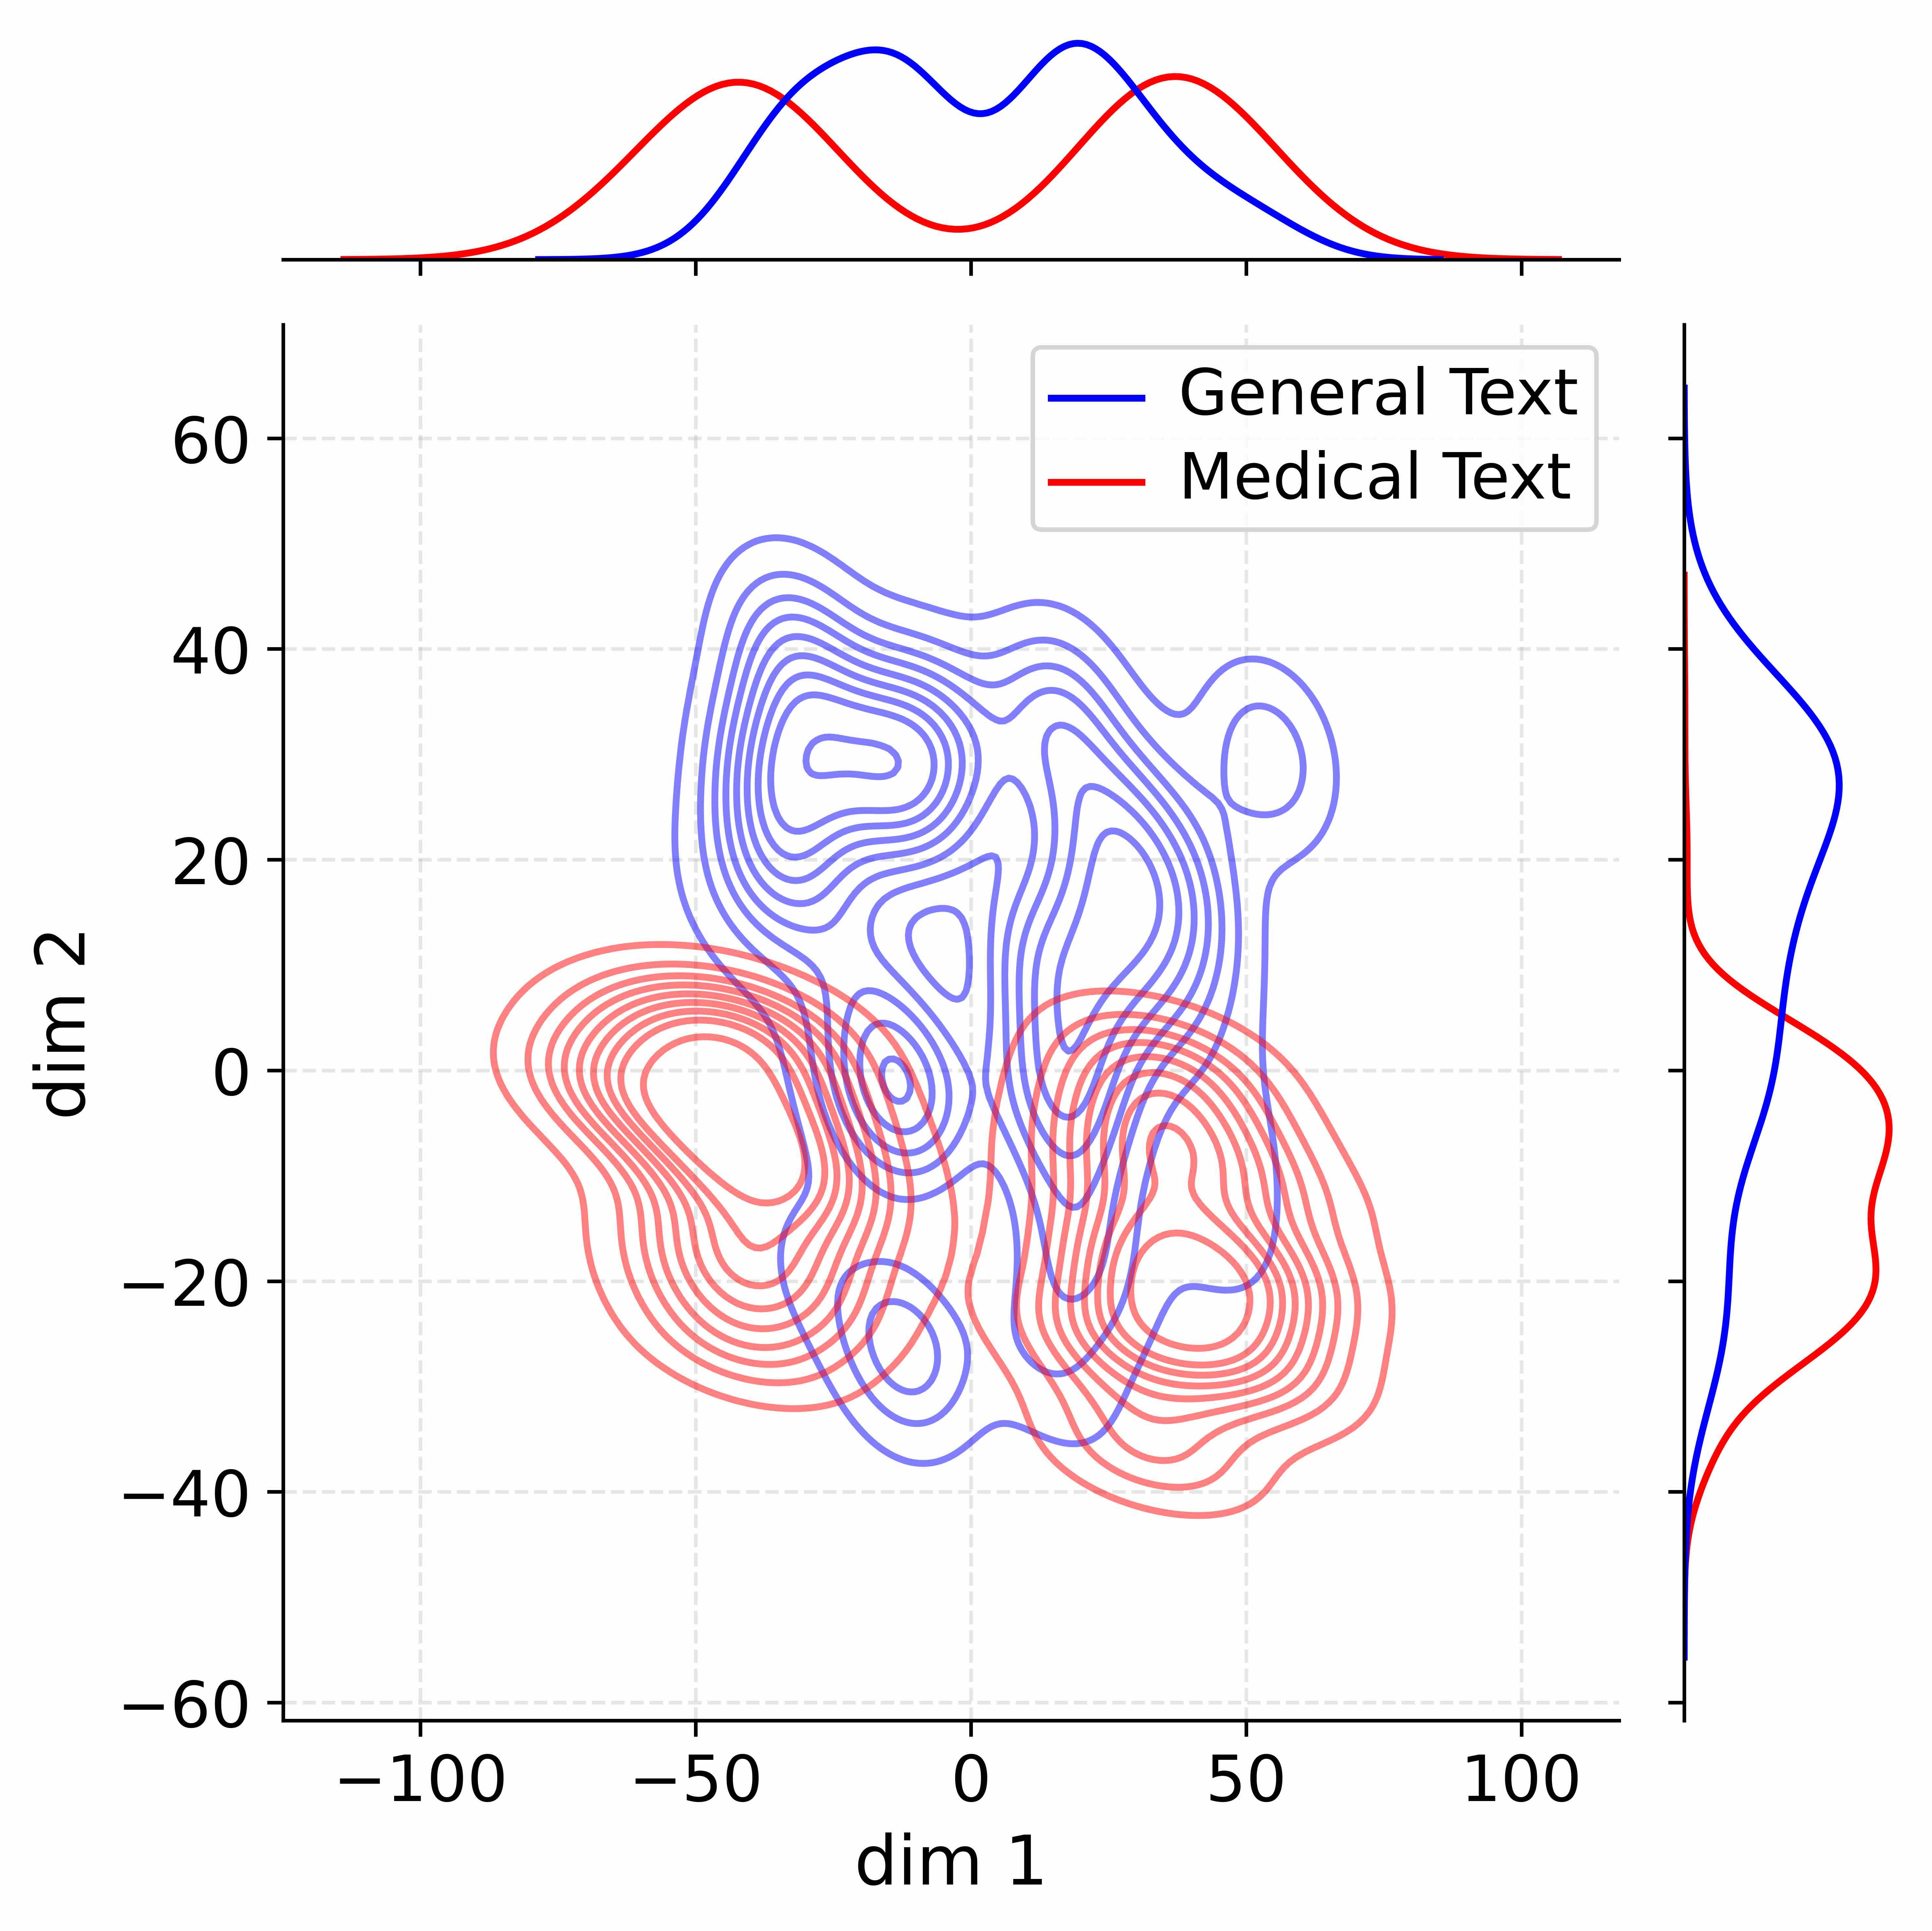
The image presents a 2D density plot visualizing the distribution of two text categories – "General Text" and "Medical Text" – projected onto a space defined by two dimensions, "dim 1" and "dim 2". Additionally, marginal distributions (kernel density estimates) are shown along the top and right edges of the plot, representing the distribution of each category along each dimension.
### Components/Axes
* **X-axis:** Labeled "dim 1", ranging approximately from -110 to 110.
* **Y-axis:** Labeled "dim 2", ranging approximately from -60 to 60.
* **Density Plot:** Contour lines represent the density of data points for each category.
* **Legend:** Located in the top-right corner, identifying the colors:
* Blue: "General Text"
* Red: "Medical Text"
* **Marginal Distributions:**
* Top: Kernel density estimates for "General Text" (blue) and "Medical Text" (red) along dim 1.
* Right: Kernel density estimates for "General Text" (blue) and "Medical Text" (red) along dim 2.
### Detailed Analysis
The density plot shows a significant overlap between the distributions of "General Text" and "Medical Text". However, there are discernible differences:
* **General Text (Blue):** The density is concentrated in the upper-left quadrant, with a peak around (dim 1 ≈ 0, dim 2 ≈ 20-40). The distribution extends towards negative dim 1 values.
* **Medical Text (Red):** The density is concentrated in the lower-right quadrant, with a peak around (dim 1 ≈ 50, dim 2 ≈ -20). The distribution extends towards positive dim 1 values.
**Marginal Distributions:**
* **Dim 1 (Top):** The "Medical Text" (red) distribution has a higher peak around dim 1 ≈ 70-80, while the "General Text" (blue) distribution has a broader peak around dim 1 ≈ -20 to 20.
* **Dim 2 (Right):** The "General Text" (blue) distribution has a higher peak around dim 2 ≈ 50, while the "Medical Text" (red) distribution has a higher peak around dim 2 ≈ -40.
### Key Observations
* The two categories are not perfectly separable in this 2D projection, as evidenced by the overlapping contour lines.
* The marginal distributions confirm the differences observed in the density plot, showing distinct peaks for each category along each dimension.
* The "Medical Text" distribution appears to be more localized along dim 1, while the "General Text" distribution is more spread out.
* The distributions are not symmetrical.
### Interpretation
This visualization likely represents the results of dimensionality reduction (e.g., PCA, t-SNE) applied to text data. The original text data, presumably represented by high-dimensional vectors, has been projected onto a 2D space for visualization. The goal is to see if the two text categories ("General Text" and "Medical Text") can be distinguished based on their positions in this reduced space.
The overlap in the density plot suggests that the two categories share some common characteristics, and a simple linear classifier might not achieve perfect accuracy. However, the differences in the distributions indicate that there *is* some information in these dimensions that can be used to differentiate between the two categories.
The marginal distributions provide additional insight into the characteristics of each category. The fact that the "Medical Text" distribution is more localized along dim 1 suggests that this dimension might capture features that are more specific to medical text. The broader distribution of "General Text" along dim 1 suggests that it is more diverse in terms of these features.
The choice of dimensionality reduction technique and the specific features used to represent the text data will influence the results. Further analysis might involve exploring higher-dimensional projections or using different feature representations to improve the separation between the categories.