\n
## Grouped Bar Charts: Model Performance Comparison (ΔΔP)
### Overview
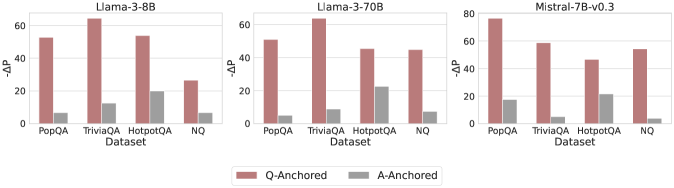
The image displays three horizontally arranged grouped bar charts, each comparing the performance of a different large language model (LLM) on four question-answering datasets. The performance metric is labeled "ΔΔP" on the y-axis. Each chart compares two experimental conditions: "Q-Anchored" and "A-Anchored."
### Components/Axes
* **Chart Titles (Top Center):** "Llama-3-8B", "Llama-3-70B", "Mistral-7B-v0.3"
* **Y-Axis Label (Left Side):** "ΔΔP" (Delta Delta P). The scale varies slightly:
* Llama-3-8B and Llama-3-70B: 0 to 60, with major ticks at 0, 20, 40, 60.
* Mistral-7B-v0.3: 0 to 80, with major ticks at 0, 20, 40, 60, 80.
* **X-Axis Label (Bottom Center of each chart):** "Dataset"
* **X-Axis Categories (Bottom of each chart):** Four datasets are listed from left to right: "PopQA", "TriviaQA", "HotpotQA", "NQ".
* **Legend (Bottom Center of entire image):** A horizontal legend defines the bar colors:
* **Reddish-Brown Bar:** "Q-Anchored"
* **Gray Bar:** "A-Anchored"
### Detailed Analysis
**Chart 1: Llama-3-8B**
* **Trend:** For all four datasets, the Q-Anchored (reddish-brown) bar is substantially taller than the A-Anchored (gray) bar.
* **Data Points (Approximate ΔΔP):**
* **PopQA:** Q-Anchored ≈ 55, A-Anchored ≈ 8.
* **TriviaQA:** Q-Anchored ≈ 65 (highest in this chart), A-Anchored ≈ 12.
* **HotpotQA:** Q-Anchored ≈ 55, A-Anchored ≈ 20 (highest A-Anchored value in this chart).
* **NQ:** Q-Anchored ≈ 28, A-Anchored ≈ 8.
**Chart 2: Llama-3-70B**
* **Trend:** Consistent with the 8B model, Q-Anchored significantly outperforms A-Anchored across all datasets.
* **Data Points (Approximate ΔΔP):**
* **PopQA:** Q-Anchored ≈ 52, A-Anchored ≈ 6.
* **TriviaQA:** Q-Anchored ≈ 65 (highest in this chart), A-Anchored ≈ 10.
* **HotpotQA:** Q-Anchored ≈ 48, A-Anchored ≈ 22 (highest A-Anchored value in this chart).
* **NQ:** Q-Anchored ≈ 46, A-Anchored ≈ 9.
**Chart 3: Mistral-7B-v0.3**
* **Trend:** The pattern holds. Q-Anchored bars are taller than A-Anchored bars for every dataset.
* **Data Points (Approximate ΔΔP):**
* **PopQA:** Q-Anchored ≈ 78 (highest value across all charts), A-Anchored ≈ 18.
* **TriviaQA:** Q-Anchored ≈ 60, A-Anchored ≈ 6.
* **HotpotQA:** Q-Anchored ≈ 45, A-Anchored ≈ 20.
* **NQ:** Q-Anchored ≈ 55, A-Anchored ≈ 5.
### Key Observations
1. **Universal Q-Anchored Superiority:** The most prominent pattern is that the "Q-Anchored" condition yields a higher ΔΔP than the "A-Anchored" condition for every single model-dataset combination shown.
2. **Dataset Performance Variability:** The absolute performance (height of bars) varies by dataset. "TriviaQA" and "PopQA" often show the highest ΔΔP values for Q-Anchored, while "NQ" and "HotpotQA" sometimes show lower peaks.
3. **Model Comparison:** The Mistral-7B-v0.3 model achieves the single highest ΔΔP value (≈78 on PopQA). The Llama-3 models (8B and 70B) show very similar performance profiles to each other.
4. **A-Anchored Consistency:** The A-Anchored performance is consistently low, generally below 20 ΔΔP, with "HotpotQA" often being the dataset where it performs "best" (relatively speaking).
### Interpretation
This visualization strongly suggests that the "Q-Anchored" method or prompting strategy is significantly more effective than the "A-Anchored" alternative for the evaluated models on these question-answering tasks, as measured by the ΔΔP metric. The consistency of this finding across three different model architectures (Llama-3 8B/70B, Mistral) and four diverse datasets implies a robust effect.
The ΔΔP metric itself likely measures a change or improvement relative to a baseline. The large positive values for Q-Anchored indicate a substantial gain. The fact that A-Anchored values are positive but much smaller suggests it may offer a minor improvement over the baseline, but is far less effective than Q-Anchoring.
The variation across datasets hints that the difficulty or nature of the task influences the absolute magnitude of the improvement, but not the relative advantage of Q-Anchoring. The outlier data point (Mistral on PopQA) may indicate a particularly strong synergy between that model's architecture and the Q-Anchored approach for that specific type of knowledge-intensive question.