## Bar Chart: Performance Comparison Across Models and Datasets
### Overview
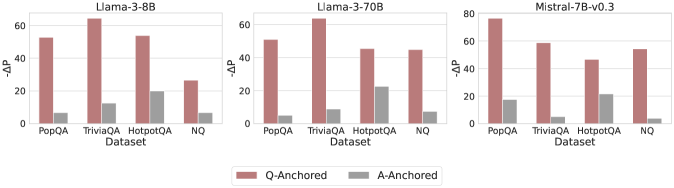
The image presents a grouped bar chart comparing performance metrics (-ΔP) across three language models (Llama-3-8B, Llama-3-70B, Mistral-7B-v0.3) and four datasets (PopQA, TriviaQA, HotpotQA, NQ). Two configurations are compared: Q-Anchored (red bars) and A-Anchored (gray bars). The y-axis measures -ΔP (higher values indicate better performance), while the x-axis categorizes datasets.
### Components/Axes
- **X-Axis**: Datasets (PopQA, TriviaQA, HotpotQA, NQ) repeated for each model section.
- **Y-Axis**: -ΔP values (0–80 range, increments of 20).
- **Legend**:
- Red = Q-Anchored
- Gray = A-Anchored
- **Model Sections**: Three distinct sub-charts labeled by model name (top-left to top-right).
### Detailed Analysis
#### Llama-3-8B Section
- **PopQA**: Q-Anchored ≈ 50, A-Anchored ≈ 5
- **TriviaQA**: Q-Anchored ≈ 60, A-Anchored ≈ 10
- **HotpotQA**: Q-Anchored ≈ 50, A-Anchored ≈ 20
- **NQ**: Q-Anchored ≈ 30, A-Anchored ≈ 5
#### Llama-3-70B Section
- **PopQA**: Q-Anchored ≈ 50, A-Anchored ≈ 5
- **TriviaQA**: Q-Anchored ≈ 45, A-Anchored ≈ 10
- **HotpotQA**: Q-Anchored ≈ 40, A-Anchored ≈ 20
- **NQ**: Q-Anchored ≈ 40, A-Anchored ≈ 5
#### Mistral-7B-v0.3 Section
- **PopQA**: Q-Anchored ≈ 70, A-Anchored ≈ 15
- **TriviaQA**: Q-Anchored ≈ 50, A-Anchored ≈ 5
- **HotpotQA**: Q-Anchored ≈ 40, A-Anchored ≈ 20
- **NQ**: Q-Anchored ≈ 45, A-Anchored ≈ 3
### Key Observations
1. **Q-Anchored Dominance**: Q-Anchored configurations consistently outperform A-Anchored across all models and datasets (e.g., Mistral-7B-v0.3 on PopQA: 70 vs. 15).
2. **Model-Specific Trends**:
- Llama-3-8B shows the largest gap in TriviaQA (60 vs. 10).
- Mistral-7B-v0.3 achieves the highest Q-Anchored value (70) on PopQA.
3. **NQ Dataset Anomaly**: NQ has the smallest performance gaps (e.g., Llama-3-8B: 30 vs. 5; Mistral-7B-v0.3: 45 vs. 3).
4. **A-Anchored Peaks**: A-Anchored values peak in HotpotQA for Llama-3-70B and Mistral-7B-v0.3 (20).
### Interpretation
The data suggests that Q-Anchored configurations generally yield superior performance, with performance gaps varying by model architecture and dataset complexity. Mistral-7B-v0.3 demonstrates the strongest Q-Anchored performance, particularly on PopQA, despite being smaller than Llama-3-70B. The NQ dataset exhibits minimal sensitivity to anchoring, possibly due to its nature (e.g., question-answering vs. open-domain tasks). The consistent A-Anchored peaks in HotpotQA may indicate dataset-specific challenges where alternative anchoring strategies resonate better. Model size does not strictly correlate with performance, as Mistral-7B-v0.3 outperforms larger Llama models in Q-Anchored tasks on PopQA, highlighting architectural efficiency as a critical factor.