## ROC Curve: Receiver Operating Characteristic (ROC) Curves
### Overview
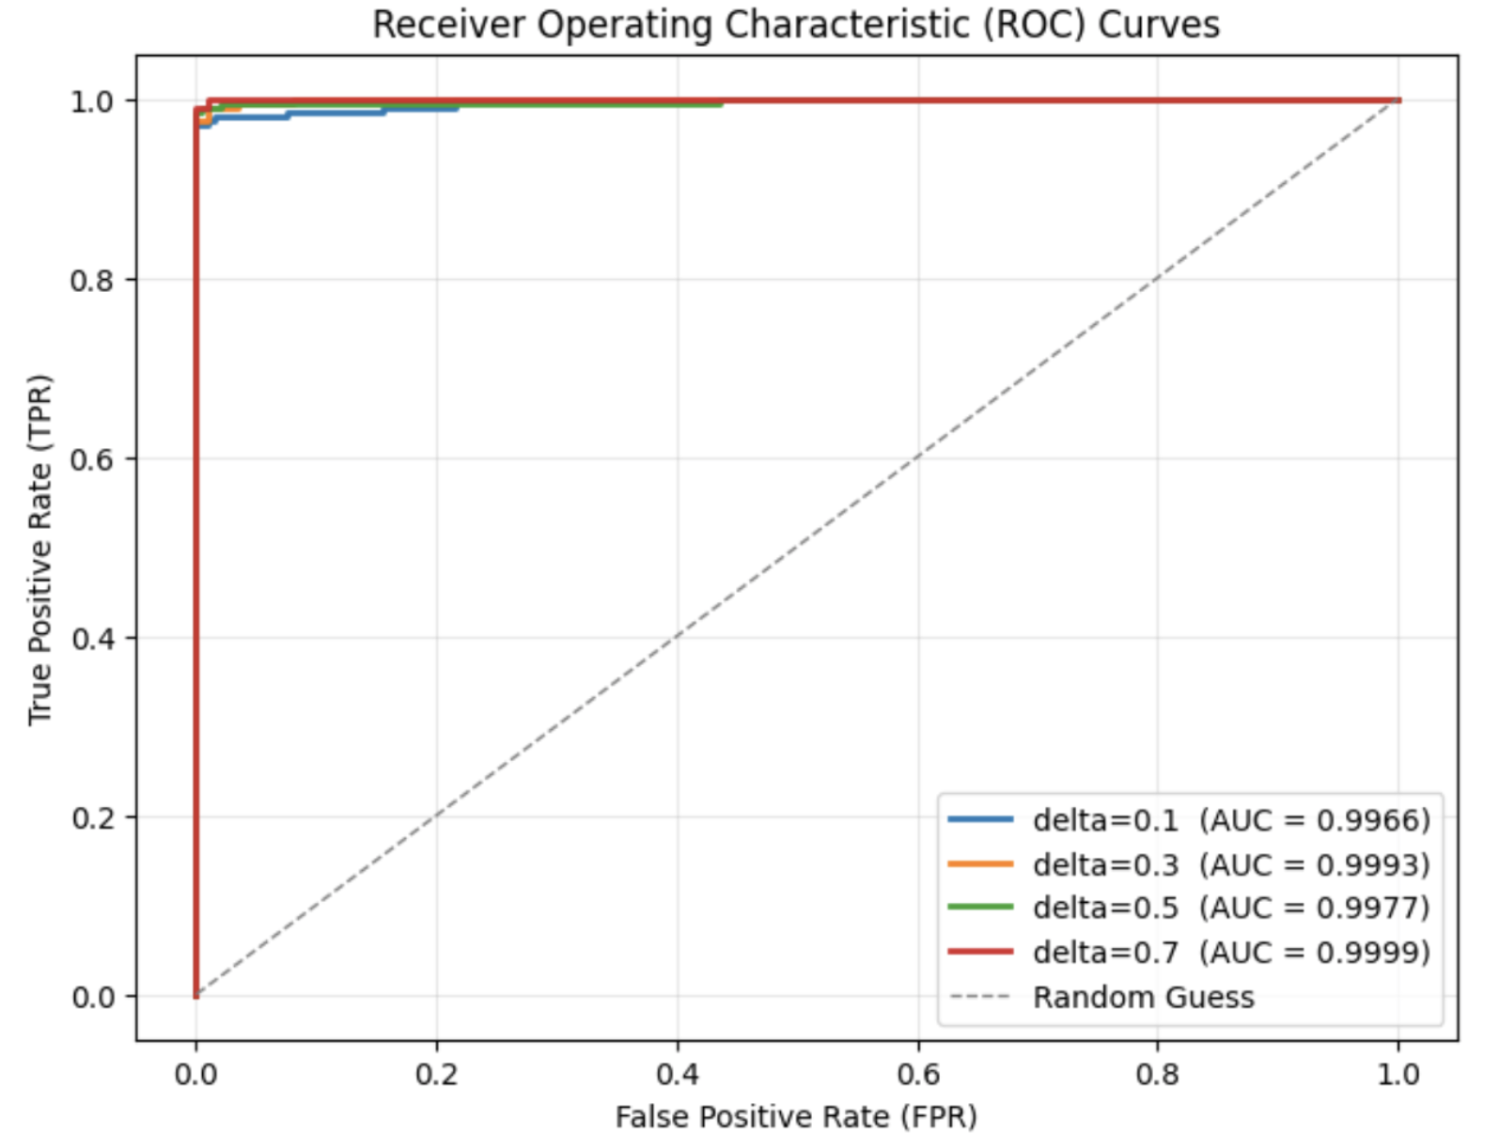
The image displays a Receiver Operating Characteristic (ROC) curve, a graphical plot that illustrates the diagnostic ability of a binary classifier system. The chart compares the trade-off between the True Positive Rate (TPR) and the False Positive Rate (FPR) for different classification thresholds (delta values). A dashed line representing a "Random Guess" is included for reference.
---
### Components/Axes
- **X-axis**: False Positive Rate (FPR), ranging from 0.0 to 1.0.
- **Y-axis**: True Positive Rate (TPR), ranging from 0.0 to 1.0.
- **Legend**: Located in the **bottom-right corner**, with the following entries:
- **Blue line**: delta=0.1 (AUC = 0.9966)
- **Orange line**: delta=0.3 (AUC = 0.9993)
- **Green line**: delta=0.5 (AUC = 0.9977)
- **Red line**: delta=0.7 (AUC = 0.9999)
- **Dashed gray line**: Random Guess (baseline performance).
---
### Detailed Analysis
#### Curves and Data Points
1. **Red line (delta=0.7)**:
- **Trend**: Nearly horizontal at TPR=1.0, with a sharp vertical rise at FPR=0.0.
- **Key points**:
- Starts at (FPR=0.0, TPR=0.99) and remains at TPR=1.0 for FPR > 0.0.
- AUC = 0.9999 (highest among all curves).
- **Spatial grounding**: Dominates the upper-right quadrant, indicating near-perfect classification.
2. **Blue line (delta=0.1)**:
- **Trend**: Slightly below the red line, with a gradual rise to TPR=1.0.
- **Key points**:
- Starts at (FPR=0.0, TPR=0.98) and reaches TPR=1.0 at FPR=0.02.
- AUC = 0.9966.
3. **Orange line (delta=0.3)**:
- **Trend**: Similar to the blue line but slightly higher.
- **Key points**:
- Starts at (FPR=0.0, TPR=0.99) and reaches TPR=1.0 at FPR=0.01.
- AUC = 0.9993.
4. **Green line (delta=0.5)**:
- **Trend**: Slightly below the orange line.
- **Key points**:
- Starts at (FPR=0.0, TPR=0.99) and reaches TPR=1.0 at FPR=0.01.
- AUC = 0.9977.
5. **Dashed gray line (Random Guess)**:
- **Trend**: Diagonal line from (0,0) to (1,1), representing random performance.
- **Key points**:
- TPR = FPR at all points (e.g., (0.5, 0.5)).
---
### Key Observations
1. **Performance hierarchy**:
- The red line (delta=0.7) outperforms all others, with the highest AUC (0.9999).
- The blue (delta=0.1) and green (delta=0.5) lines show slightly lower performance, while the orange (delta=0.3) line is intermediate.
2. **Threshold sensitivity**:
- Higher delta values (e.g., 0.7) correspond to better TPR at lower FPR, indicating optimal classification thresholds.
3. **Random Guess baseline**:
- The dashed line confirms that all curves significantly outperform random guessing.
---
### Interpretation
- **Model effectiveness**: The ROC curves demonstrate that the classifier achieves near-perfect performance across all delta values, with the highest AUC (0.9999) for delta=0.7. This suggests the model is highly reliable for binary classification tasks.
- **Threshold trade-offs**:
- Lower delta values (e.g., 0.1) may prioritize sensitivity (higher TPR) at the cost of increased FPR, while higher delta values (e.g., 0.7) optimize for precision (lower FPR) with minimal TPR loss.
- **AUC significance**:
- AUC values close to 1.0 indicate strong discriminative power. The red line’s AUC (0.9999) implies the model is nearly indistinguishable from a perfect classifier.
- **Practical implications**:
- The curves highlight the importance of selecting an appropriate delta value based on the desired balance between TPR and FPR. For instance, delta=0.7 is optimal for scenarios requiring high precision, while delta=0.1 may be preferable for maximizing sensitivity.
---
### Notes on Uncertainty
- All TPR and FPR values are approximate, as the chart lacks explicit numerical annotations for intermediate points. The red line’s TPR=1.0 is inferred from its horizontal alignment, while other curves’ values are estimated based on their relative positions.
- The AUC values are explicitly provided in the legend and are considered precise.