## Bar Chart: Max Triple Overlap with Any Training Question
### Overview
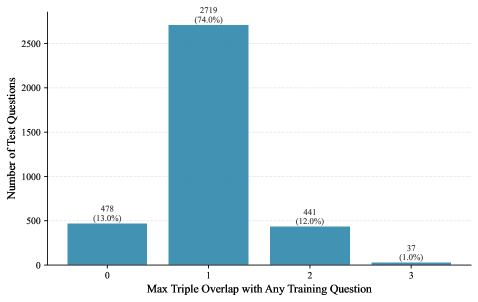
The image is a bar chart that displays the number of test questions against the maximum triple overlap with any training question. The x-axis represents the maximum triple overlap, ranging from 0 to 3. The y-axis represents the number of test questions, ranging from 0 to 2500. Each bar corresponds to a specific overlap value, with the height of the bar indicating the number of test questions with that overlap. The bars are all the same color, a shade of blue.
### Components/Axes
* **X-axis:** "Max Triple Overlap with Any Training Question" with categories 0, 1, 2, and 3.
* **Y-axis:** "Number of Test Questions" with a scale from 0 to 2500, incrementing by 500.
* **Bars:** Each bar represents the number of test questions for a given maximum triple overlap. The bars are labeled with the exact count and the percentage of the total.
### Detailed Analysis
* **Overlap 0:** 478 test questions (13.0%)
* **Overlap 1:** 2719 test questions (74.0%)
* **Overlap 2:** 441 test questions (12.0%)
* **Overlap 3:** 37 test questions (1.0%)
### Key Observations
* The majority of test questions (74.0%) have a maximum triple overlap of 1 with any training question.
* The number of test questions decreases significantly as the maximum triple overlap increases from 1 to 3.
* The number of test questions with 0 overlap is similar to the number of test questions with 2 overlap.
### Interpretation
The bar chart indicates that most test questions have a moderate level of overlap with the training questions. The high percentage of questions with an overlap of 1 suggests that the test questions are related to the training material, but not identical. The low percentage of questions with an overlap of 3 suggests that very few test questions are directly derived from the training questions. The data suggests that the test questions are designed to assess understanding of the training material rather than rote memorization.