## Bar Chart: Distribution of Test Questions by Maximum Triple Overlap with Training Questions
### Overview
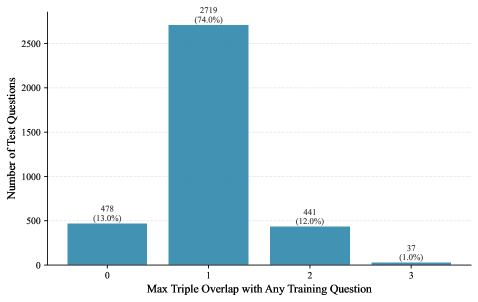
This is a vertical bar chart illustrating the frequency distribution of test questions based on their maximum "triple overlap" with any question in a training set. The chart quantifies how many test questions share a specific level of overlap (0, 1, 2, or 3) with training questions. The data indicates a highly skewed distribution, with the vast majority of test questions having an overlap of 1.
### Components/Axes
* **Chart Type:** Vertical Bar Chart.
* **X-Axis (Horizontal):**
* **Label:** "Max Triple Overlap with Any Training Question"
* **Categories/Markers:** 0, 1, 2, 3. These represent discrete levels of overlap.
* **Y-Axis (Vertical):**
* **Label:** "Number of Test Questions"
* **Scale:** Linear scale from 0 to 2500, with major gridlines at intervals of 500 (0, 500, 1000, 1500, 2000, 2500).
* **Data Series:** A single data series represented by four blue bars. There is no legend, as only one category of data is plotted.
* **Data Labels:** Each bar is annotated at its top with the exact count and its percentage of the total test questions.
### Detailed Analysis
The chart presents the following precise data points for each overlap category:
1. **Overlap = 0:**
* **Count:** 478 test questions.
* **Percentage:** 13.0% of the total.
* **Visual Trend:** This is the second-tallest bar, positioned at the far left of the chart.
2. **Overlap = 1:**
* **Count:** 2719 test questions.
* **Percentage:** 74.0% of the total.
* **Visual Trend:** This is the dominant, tallest bar by a significant margin, located in the center-left position. It represents nearly three-quarters of all test questions.
3. **Overlap = 2:**
* **Count:** 441 test questions.
* **Percentage:** 12.0% of the total.
* **Visual Trend:** This bar is slightly shorter than the "0" bar and is positioned to the right of the central peak.
4. **Overlap = 3:**
* **Count:** 37 test questions.
* **Percentage:** 1.0% of the total.
* **Visual Trend:** This is the shortest bar, appearing as a small sliver at the far right of the chart.
**Total Test Questions (Calculated):** 478 + 2719 + 441 + 37 = 3,675. The sum of the percentages (13.0% + 74.0% + 12.0% + 1.0%) equals 100.0%.
### Key Observations
* **Dominant Category:** The category "1" is overwhelmingly the most common, containing 74% of all test questions.
* **Sharp Drop-off:** There is a dramatic decrease in frequency as the overlap value increases beyond 1. The count for overlap=2 is about 6 times smaller than for overlap=1, and the count for overlap=3 is negligible (1%).
* **Low Zero-Overlap:** Only 13% of test questions have zero triple overlap with any training question, suggesting most test questions share at least some structural similarity with the training data.
* **Distribution Shape:** The distribution is heavily right-skewed, with a single, pronounced mode at overlap=1.
### Interpretation
This chart provides a diagnostic view of the relationship between a model's training set and its test set, specifically regarding "triple overlap"—likely referring to the sharing of three key elements (e.g., entities, relations, and attributes in a knowledge graph or complex QA context).
* **Data Suggestion:** The data strongly suggests that the test set is not composed of entirely novel, unseen structures. Instead, 87% of test questions (74% + 12% + 1%) have at least a partial structural precedent (overlap of 1, 2, or 3) in the training data. The high concentration at overlap=1 indicates that while exact复制 (overlap=3) is rare, the model is predominantly being evaluated on questions that recombine or minimally vary patterns it has seen during training.
* **Relationship Between Elements:** The x-axis represents increasing degrees of similarity to training data. The y-axis shows the prevalence of each similarity level. The inverse relationship between overlap value and frequency is clear: as the required similarity to a training question increases, the number of such test questions plummets.
* **Notable Anomaly/Trend:** The most significant trend is the massive spike at overlap=1. This could indicate a deliberate test design choice to evaluate generalization from single-overlap patterns, or it could reveal a limitation in the test set's diversity. The near-absence of overlap=3 questions (1%) suggests the test avoids direct memorization checks.
* **Implication for Model Evaluation:** A model performing well on this test set may be proficient at interpolating from known patterns (overlap=1) but is not heavily tested on extrapolating to completely novel structures (overlap=0) or on handling highly complex, multi-faceted similarities (overlap=2, 3). The evaluation primarily measures robustness to minor variations of trained concepts.