## Bar Chart: Max Triple Overlap with Any Training Question
### Overview
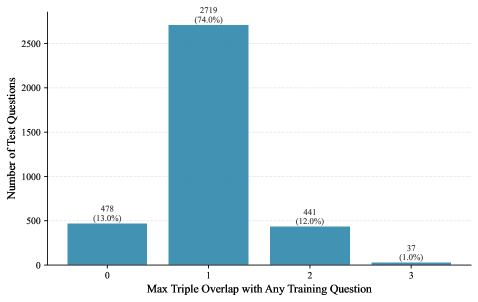
The chart displays the distribution of test questions categorized by their maximum overlap with any training question. The y-axis represents the "Number of Test Questions," while the x-axis shows the "Max Triple Overlap with Any Training Question" (values 0 to 3). Four bars represent distinct categories, with numerical values and percentages embedded in each bar.
### Components/Axes
- **X-axis**: Labeled "Max Triple Overlap with Any Training Question," with categories 0, 1, 2, and 3.
- **Y-axis**: Labeled "Number of Test Questions," scaled from 0 to 2500 in increments of 500.
- **Bars**: Four vertical bars with embedded text showing absolute values and percentages:
- **Bar 0**: 478 (13.0%)
- **Bar 1**: 2719 (74.0%)
- **Bar 2**: 441 (12.0%)
- **Bar 3**: 37 (1.0%)
### Detailed Analysis
- **Bar 0 (0 overlap)**: 478 test questions (13.0%) have no overlap with training questions.
- **Bar 1 (1 overlap)**: 2719 test questions (74.0%) have a maximum overlap of 1 with training questions.
- **Bar 2 (2 overlap)**: 441 test questions (12.0%) have a maximum overlap of 2 with training questions.
- **Bar 3 (3 overlap)**: 37 test questions (1.0%) have a maximum overlap of 3 with training questions.
### Key Observations
1. **Dominance of 1-overlap category**: The majority (74.0%) of test questions have a maximum overlap of 1 with training questions.
2. **Significant drop at 3-overlap**: Only 1.0% of test questions have the highest possible overlap (3), indicating rare alignment.
3. **Balanced distribution at lower overlaps**: 13.0% (0 overlap) and 12.0% (2 overlap) suggest moderate variability in test question alignment.
### Interpretation
The data suggests that most test questions (74.0%) share a minimal overlap (1) with training questions, while a small fraction (1.0%) exhibit perfect alignment (3). The near-equal distribution of 0-overlap (13.0%) and 2-overlap (12.0%) categories implies that test questions are either poorly aligned or moderately aligned with training data. This could indicate challenges in ensuring test question relevance or potential redundancy in training data. The stark contrast between the 1-overlap and 3-overlap categories highlights the difficulty of achieving high alignment in this dataset.