## Line Chart: Model Performance Comparison
### Overview
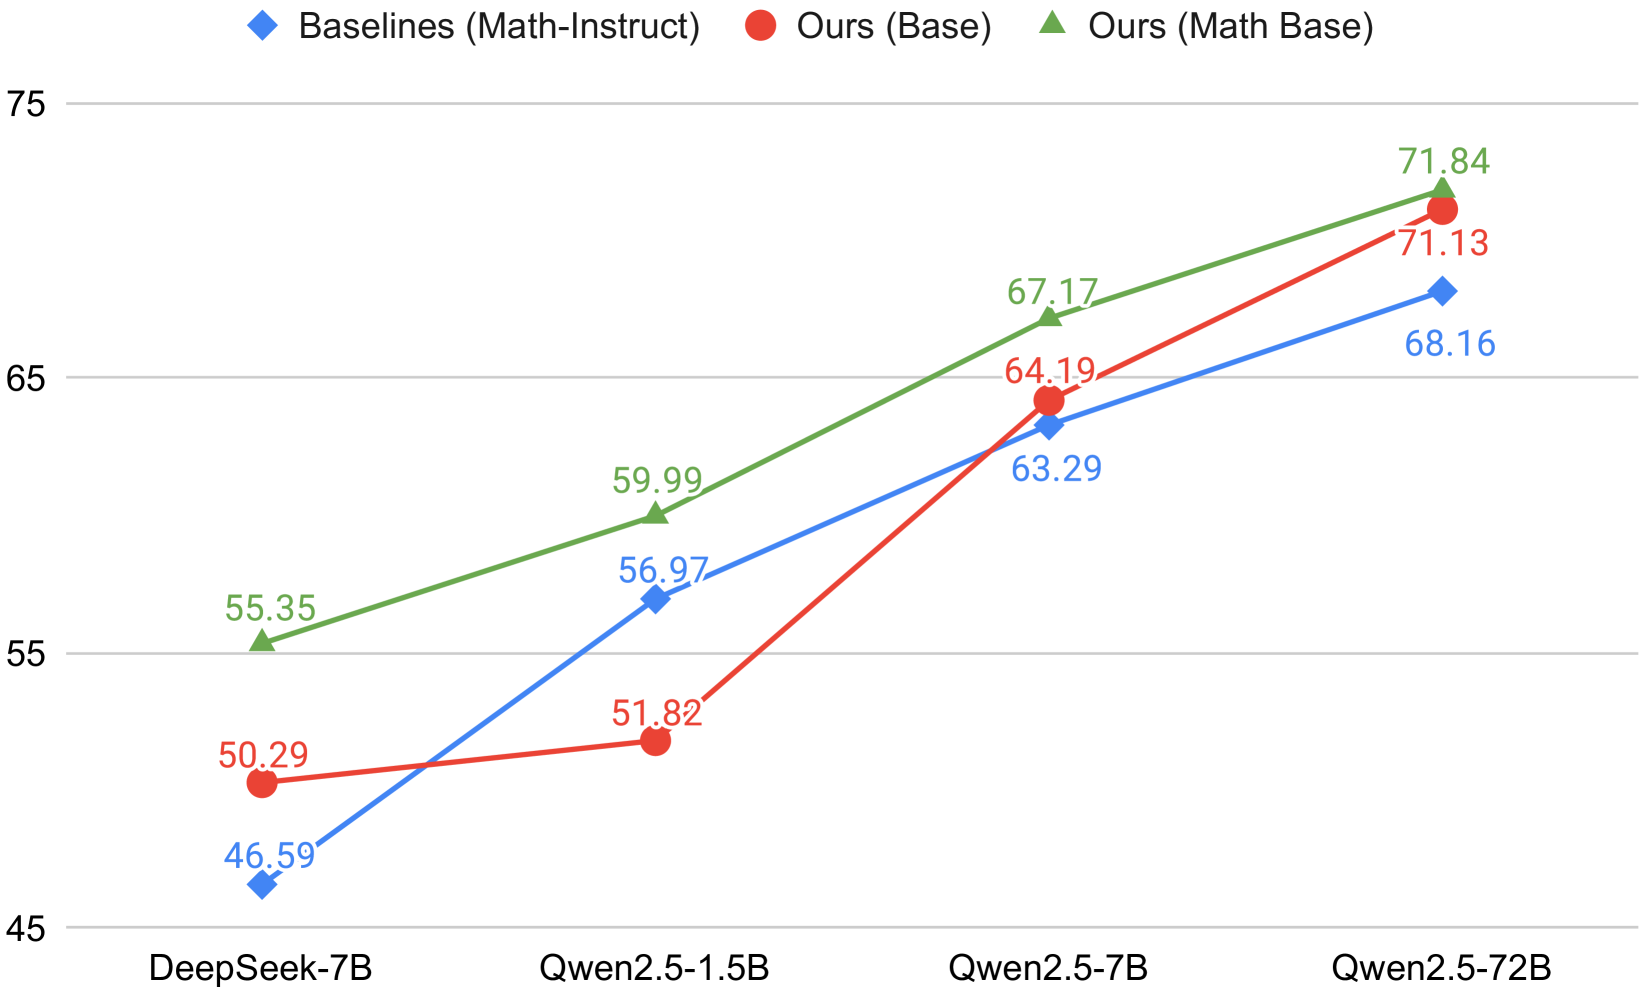
This image displays a line chart comparing the performance metrics of three different model categories—"Baselines (Math-Instruct)", "Ours (Base)", and "Ours (Math Base)"—across four distinct model architectures: DeepSeek-7B, Qwen2.5-1.5B, Qwen2.5-7B, and Qwen2.5-72B. The chart illustrates how performance scores change as the model size and architecture vary.
### Components/Axes
* **X-Axis (Horizontal):** Categorical labels representing the models: DeepSeek-7B, Qwen2.5-1.5B, Qwen2.5-7B, and Qwen2.5-72B.
* **Y-Axis (Vertical):** Numerical scale representing performance scores, ranging from 45 to 75, with grid lines at intervals of 10.
* **Legend (Top):**
* **Blue Diamond:** Baselines (Math-Instruct)
* **Red Circle:** Ours (Base)
* **Green Triangle:** Ours (Math Base)
### Detailed Analysis
The chart plots three distinct data series. Below is the extraction of values for each model:
**1. Baselines (Math-Instruct) [Blue Diamond Line]**
* *Trend:* The line shows a sharp upward trend from DeepSeek-7B to Qwen2.5-1.5B, followed by a steady, moderate upward trend through the remaining models.
* *Values:*
* DeepSeek-7B: 46.59
* Qwen2.5-1.5B: 56.97
* Qwen2.5-7B: 63.29
* Qwen2.5-72B: 68.16
**2. Ours (Base) [Red Circle Line]**
* *Trend:* The line is relatively flat between DeepSeek-7B and Qwen2.5-1.5B, followed by a very steep upward slope between Qwen2.5-1.5B and Qwen2.5-7B, and a continued upward trend to Qwen2.5-72B.
* *Values:*
* DeepSeek-7B: 50.29
* Qwen2.5-1.5B: 51.82
* Qwen2.5-7B: 64.19
* Qwen2.5-72B: 71.13
**3. Ours (Math Base) [Green Triangle Line]**
* *Trend:* This line shows a consistent, steady upward trend across all model sizes. It remains the highest-performing series at every data point.
* *Values:*
* DeepSeek-7B: 55.35
* Qwen2.5-1.5B: 59.99
* Qwen2.5-7B: 67.17
* Qwen2.5-72B: 71.84
### Summary Table
| Model | Baselines (Math-Instruct) | Ours (Base) | Ours (Math Base) |
| :--- | :--- | :--- | :--- |
| **DeepSeek-7B** | 46.59 | 50.29 | 55.35 |
| **Qwen2.5-1.5B** | 56.97 | 51.82 | 59.99 |
| **Qwen2.5-7B** | 63.29 | 64.19 | 67.17 |
| **Qwen2.5-72B** | 68.16 | 71.13 | 71.84 |
### Key Observations
* **Performance Leader:** The "Ours (Math Base)" (Green) series consistently outperforms both the "Baselines" and "Ours (Base)" models across all four architectures.
* **Crossover Point:** The "Ours (Base)" (Red) series starts lower than the "Baselines" (Blue) at the Qwen2.5-1.5B mark (51.82 vs 56.97), but it overtakes the baseline at the Qwen2.5-7B mark (64.19 vs 63.29) and maintains that lead at the 72B mark.
* **Scaling Efficiency:** The "Ours (Base)" model shows significant performance gains as the model size increases, particularly between the 1.5B and 7B versions, suggesting better scaling efficiency compared to the baseline.
### Interpretation
The data demonstrates that the "Math Base" training methodology provides a clear and consistent performance advantage over the standard "Base" and "Baseline" approaches.
Interestingly, while the "Ours (Base)" model is less effective than the "Baselines" on the smaller 1.5B model, it demonstrates superior scaling capabilities. This suggests that the "Ours (Base)" architecture may require larger parameter counts to fully realize its potential compared to the baseline, which appears to be more optimized for smaller model sizes. The "Ours (Math Base)" approach appears to be the most robust, providing high performance regardless of the model size, effectively combining the benefits of the "Math" training with the scaling properties of the "Ours" architecture.