## Line Chart: Model Performance Comparison
### Overview
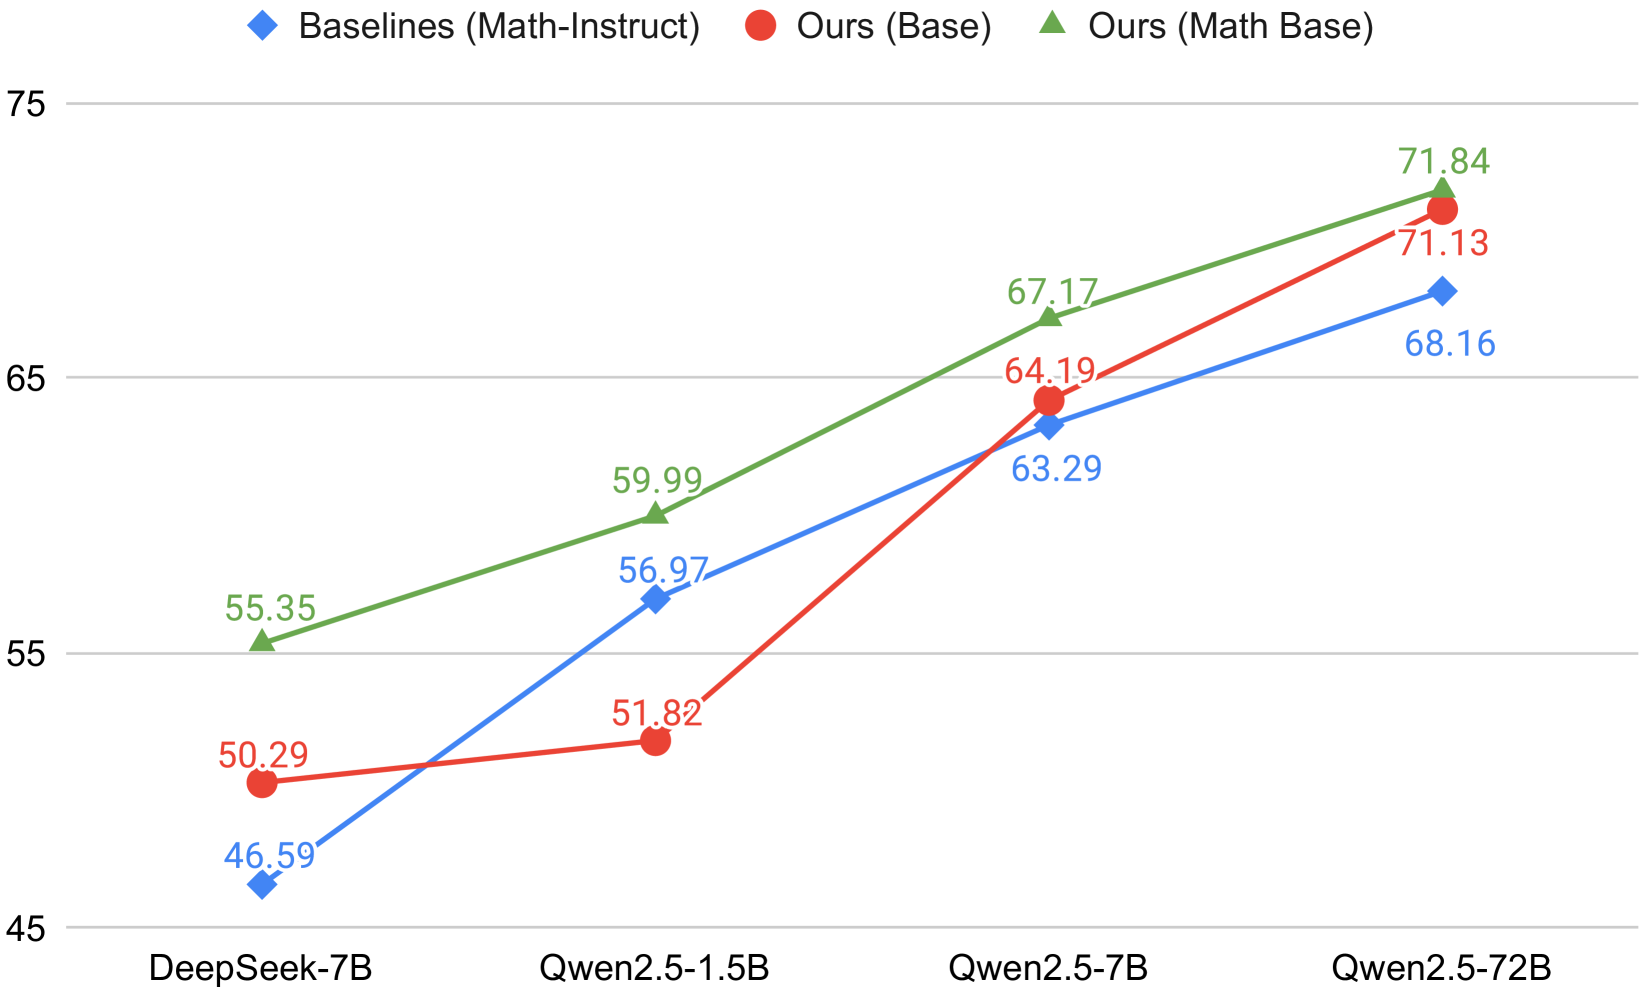
The image is a line chart comparing the performance of different language models on a specific task. The chart plots the performance of "Baselines (Math-Instruct)", "Ours (Base)", and "Ours (Math Base)" across four different model sizes: DeepSeek-7B, Qwen2.5-1.5B, Qwen2.5-7B, and Qwen2.5-72B. The y-axis represents the performance metric, ranging from 45 to 75.
### Components/Axes
* **X-axis:** Model Size (DeepSeek-7B, Qwen2.5-1.5B, Qwen2.5-7B, Qwen2.5-72B)
* **Y-axis:** Performance Metric (scale from 45 to 75, with tick marks at 5 unit intervals)
* **Legend:** Located at the top of the chart.
* Blue diamond: Baselines (Math-Instruct)
* Red circle: Ours (Base)
* Green triangle: Ours (Math Base)
### Detailed Analysis
**1. Baselines (Math-Instruct) - Blue Line:**
The blue line represents the performance of the baseline model. The trend is generally upward, indicating improved performance with larger model sizes.
* DeepSeek-7B: 46.59
* Qwen2.5-1.5B: 56.97
* Qwen2.5-7B: 63.29
* Qwen2.5-72B: 68.16
**2. Ours (Base) - Red Line:**
The red line represents the performance of "Ours (Base)". The trend is also upward, with a significant jump between Qwen2.5-1.5B and Qwen2.5-7B.
* DeepSeek-7B: 50.29
* Qwen2.5-1.5B: 51.82
* Qwen2.5-7B: 64.19
* Qwen2.5-72B: 71.13
**3. Ours (Math Base) - Green Line:**
The green line represents the performance of "Ours (Math Base)". This model consistently outperforms the other two across all model sizes. The trend is upward.
* DeepSeek-7B: 55.35
* Qwen2.5-1.5B: 59.99
* Qwen2.5-7B: 67.17
* Qwen2.5-72B: 71.84
### Key Observations
* "Ours (Math Base)" (green line) consistently achieves the highest performance across all model sizes.
* The performance gap between "Ours (Math Base)" and the other two models is most pronounced at smaller model sizes (DeepSeek-7B and Qwen2.5-1.5B).
* All three models show a significant performance increase when scaling from Qwen2.5-1.5B to Qwen2.5-7B.
* The performance of "Ours (Base)" (red line) catches up to "Baselines (Math-Instruct)" (blue line) at Qwen2.5-7B and surpasses it at Qwen2.5-72B.
### Interpretation
The chart demonstrates the impact of model size and training approach on performance. "Ours (Math Base)" consistently outperforms the baseline, suggesting that the "Math Base" training approach is effective. The significant performance jump observed for all models when scaling from Qwen2.5-1.5B to Qwen2.5-7B highlights the importance of model size for this particular task. The fact that "Ours (Base)" eventually surpasses the baseline suggests that even without the "Math Base" training, their approach is beneficial at larger model sizes. The data suggests that both model size and training methodology contribute to overall performance, with "Ours (Math Base)" representing the best combination of the two.