# Technical Document Extraction: Scatter Plot Analysis
## Legend and Labels
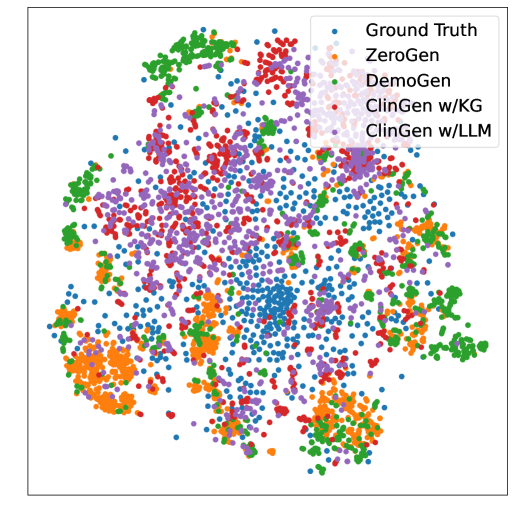
- **Legend Entries**:
- **Ground Truth**: Blue dots
- **ZeroGen**: Orange dots
- **DemoGen**: Green dots
- **ClinGen w/KG**: Red dots
- **ClinGen w/LLM**: Purple dots
## Key Trends and Observations
1. **Data Distribution**:
- **ClinGen w/KG (Red)** and **ClinGen w/LLM (Purple)** exhibit the most dispersed distribution across the plot, suggesting higher variability or broader coverage in their respective categories.
- **ZeroGen (Orange)** and **DemoGen (Green)** show tighter clustering, indicating more concentrated or similar data points within these groups.
- **Ground Truth (Blue)** is interspersed throughout the plot, acting as a reference for comparison with generated data.
2. **Visual Patterns**:
- No clear separation between categories is observed, implying potential overlap in the feature space.
- The density of points varies regionally, with some areas (e.g., lower-left quadrant) showing higher concentrations of specific categories.
## Data Structure
- **Axes**: No explicit axis titles or numerical markers are visible in the image. The plot appears to represent a 2D embedding (e.g., t-SNE, UMAP) of high-dimensional data.
- **Data Points**:
- Total points: ~1,000+ (estimated from visual density).
- Distribution: Non-uniform, with clusters and outliers present.
## Notes
- The image lacks axis labels, numerical data, or a colorbar, limiting quantitative analysis.
- The legend confirms five distinct categories, with color coding used to differentiate them.
- No textual annotations or data tables are embedded in the plot.
This description is derived solely from the visual content of the image. No additional assumptions or interpretations are included.