## Line Chart with Confidence Intervals: OOD Generalization: 10×10 → 15×15 Transfer
### Overview
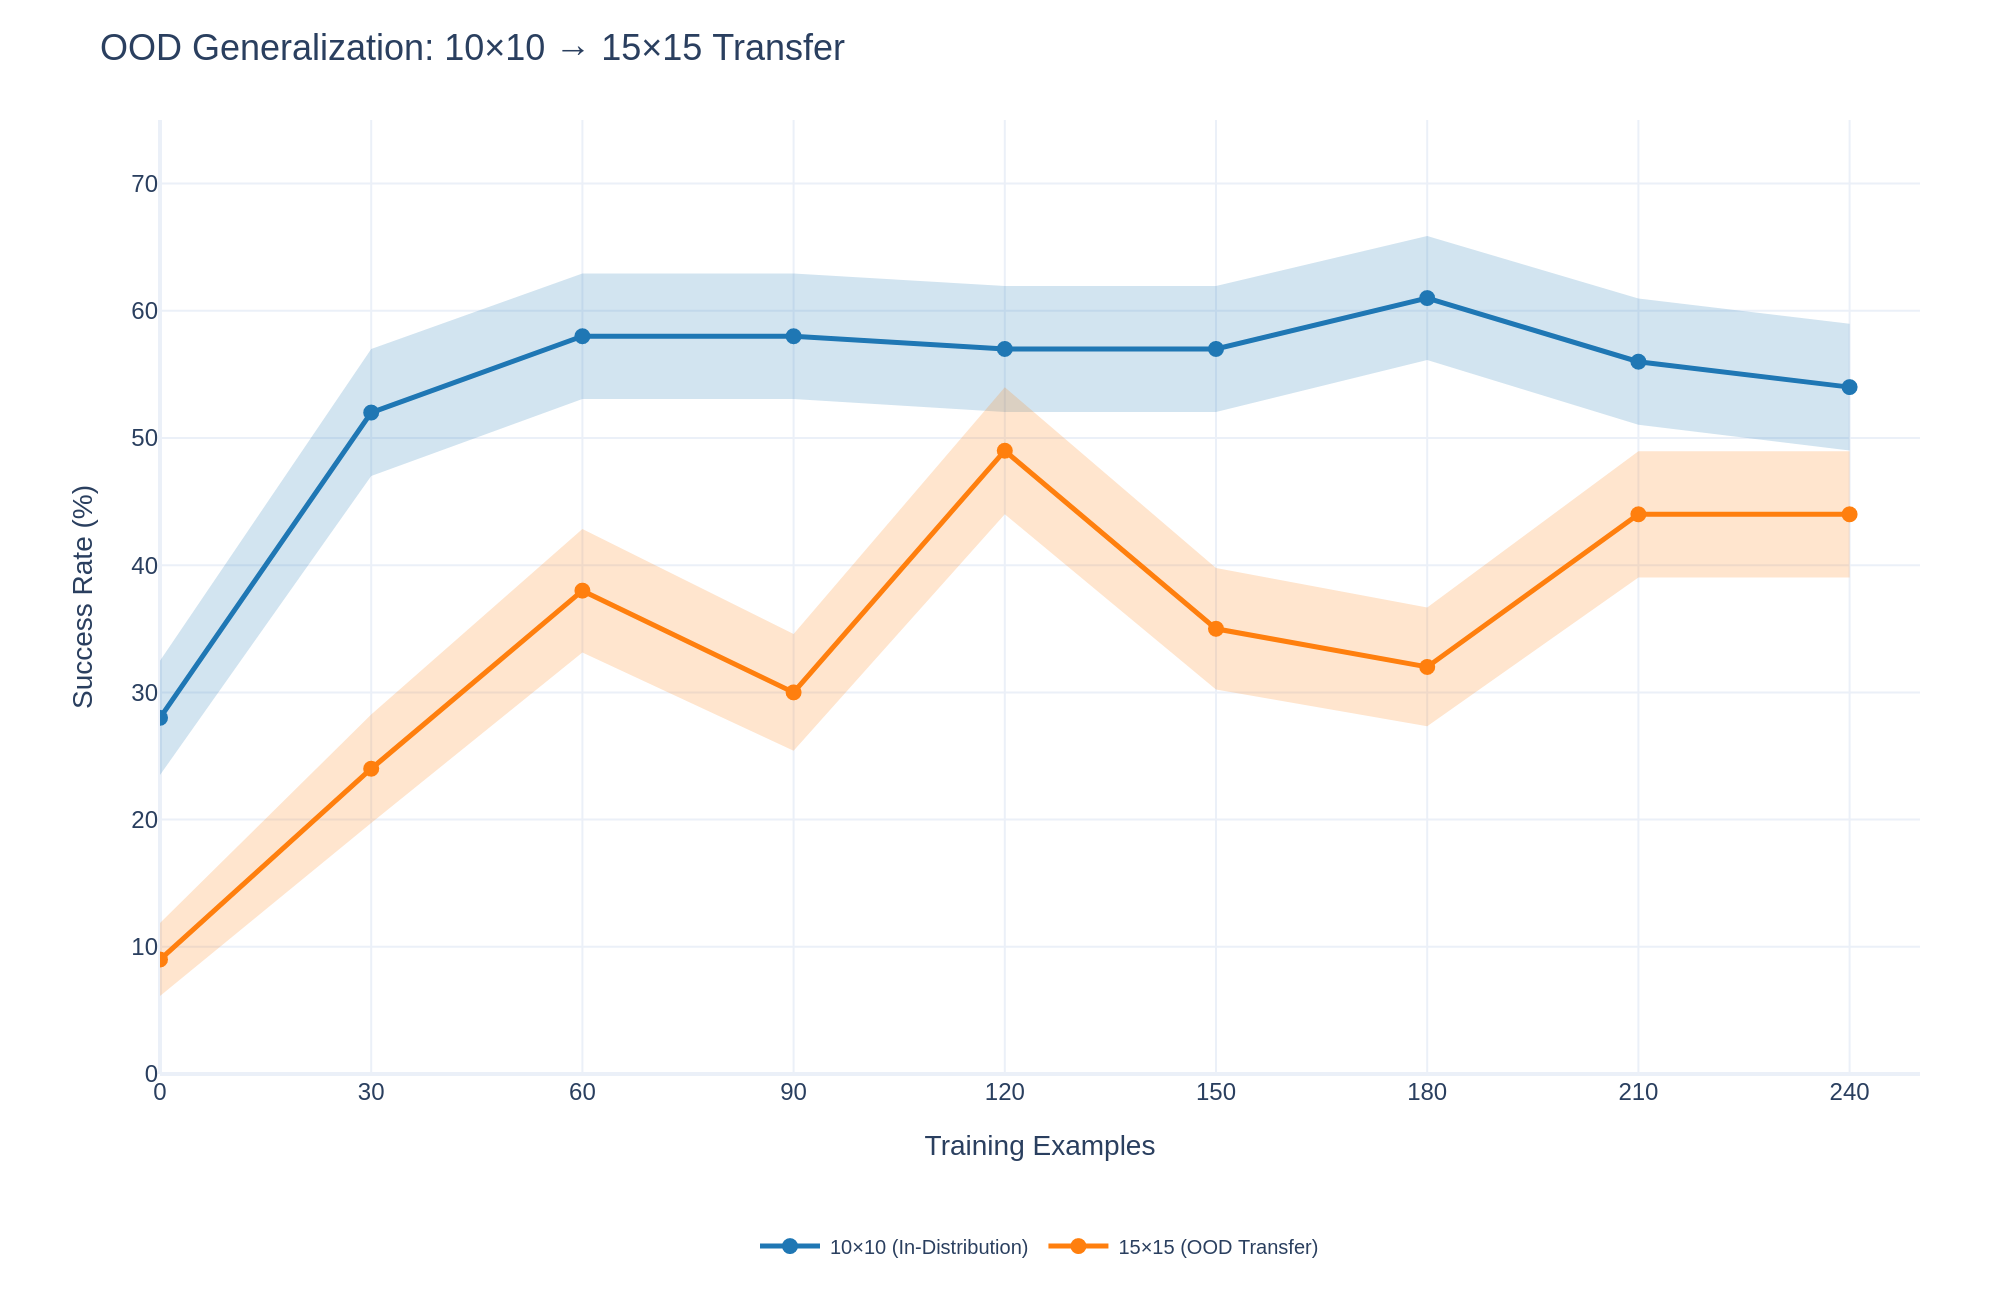
This is a line chart with shaded confidence intervals, illustrating the performance of a model on two related tasks as the number of training examples increases. The chart compares the model's success rate on an "in-distribution" task (10×10 grid) versus its ability to transfer that learning to an "out-of-distribution" (OOD) task (a larger 15×15 grid).
### Components/Axes
* **Chart Title:** "OOD Generalization: 10×10 → 15×15 Transfer" (located at the top-left).
* **X-Axis:** Labeled "Training Examples". It is a linear scale with major tick marks at 0, 30, 60, 90, 120, 150, 180, 210, and 240.
* **Y-Axis:** Labeled "Success Rate (%)". It is a linear scale with major tick marks at 0, 10, 20, 30, 40, 50, 60, and 70.
* **Legend:** Positioned at the bottom-center of the chart.
* A blue line with circular markers is labeled "10×10 (In-Distribution)".
* An orange line with circular markers is labeled "15×15 (OOD Transfer)".
* **Data Series & Confidence Intervals:** Each data series is represented by a solid line connecting circular data points. A semi-transparent shaded area of the corresponding color surrounds each line, representing the confidence interval or variance around the mean performance.
### Detailed Analysis
**Data Series 1: 10×10 (In-Distribution) - Blue Line**
* **Trend:** The line shows a steep initial increase, followed by a plateau with minor fluctuations. It consistently remains above the orange line.
* **Data Points (Approximate Success Rate %):**
* 0 Training Examples: ~28%
* 30: ~52%
* 60: ~58%
* 90: ~58%
* 120: ~57%
* 150: ~57%
* 180: ~61% (Peak)
* 210: ~56%
* 240: ~54%
* **Confidence Interval (Shaded Blue Area):** The interval is widest at the start (0 examples) and narrows as training examples increase, suggesting reduced variance with more data. It spans approximately ±5-8% around the mean line.
**Data Series 2: 15×15 (OOD Transfer) - Orange Line**
* **Trend:** The line shows an initial increase, followed by significant volatility with peaks and troughs before a final rise and plateau. It is consistently below the blue line.
* **Data Points (Approximate Success Rate %):**
* 0 Training Examples: ~9%
* 30: ~24%
* 60: ~38%
* 90: ~30% (Local trough)
* 120: ~49% (Local peak)
* 150: ~35%
* 180: ~32%
* 210: ~44%
* 240: ~44%
* **Confidence Interval (Shaded Orange Area):** The interval is also wider at lower training counts and shows considerable width throughout, indicating higher uncertainty or variance in the OOD transfer performance compared to the in-distribution task. It spans approximately ±6-10% around the mean line.
### Key Observations
1. **Performance Gap:** There is a persistent and significant gap between in-distribution (blue) and out-of-distribution (orange) performance across all training set sizes. The model performs substantially better on the task it was trained on.
2. **Learning Curves:** Both curves show rapid initial learning (0 to 60 examples). The in-distribution curve then stabilizes, while the OOD curve is highly unstable between 60 and 180 examples before stabilizing at a higher level.
3. **Peak Performance:** The in-distribution task peaks at ~61% success with 180 examples. The OOD task's highest observed point is ~49% at 120 examples, but it ends at a stable ~44% from 210 examples onward.
4. **Volatility:** The OOD transfer performance (orange) exhibits much greater volatility, with a notable dip at 90 examples and a sharp peak at 120 examples, suggesting the transfer learning process is less stable.
### Interpretation
This chart demonstrates the challenge of **out-of-distribution generalization**. The model learns the primary 10×10 task effectively, with performance quickly reaching a plateau of around 55-60% success. However, applying this learned knowledge to a larger, structurally similar 15×15 task (the OOD transfer) is markedly less effective and less reliable.
The persistent gap indicates that the features or strategies learned on the smaller grid do not perfectly translate to the larger one. The volatility in the orange line suggests that with limited data, the model's ability to generalize is sensitive to the specific training examples provided. The eventual stabilization of the OOD curve at ~44% (still well below the in-distribution performance) implies that while some transfer learning occurs, it hits a ceiling. The model likely requires either more diverse training data or a different architectural approach to bridge this generalization gap more effectively. The wider confidence intervals for the OOD task further underscore the increased uncertainty inherent in making predictions on data that differs from the training distribution.