## Line Chart: OOD Generalization: 10x10 → 15x15 Transfer
### Overview
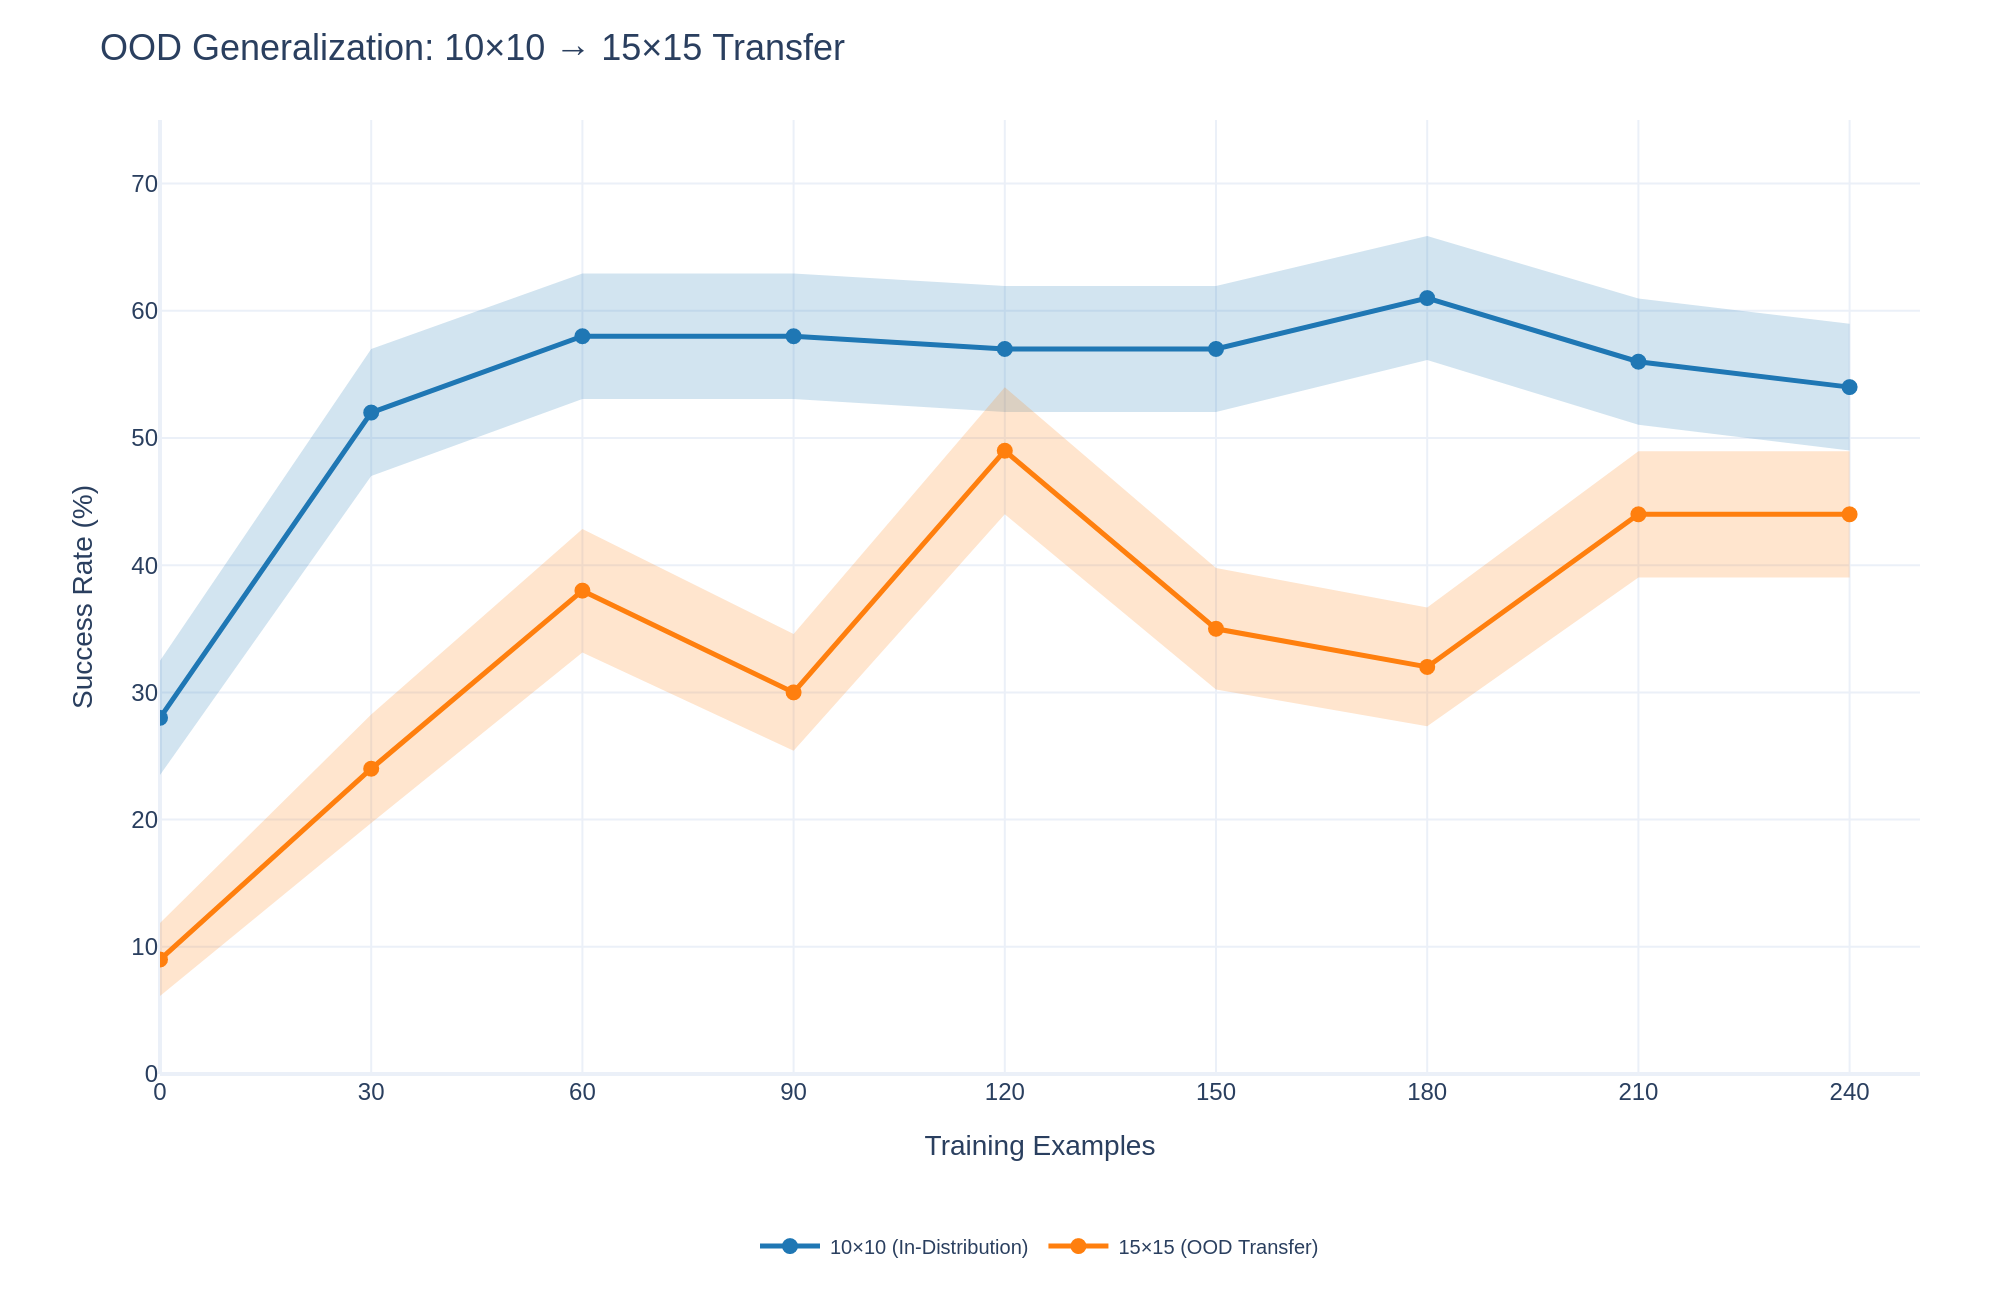
The chart compares the success rates of two models: a 10x10 "In-Distribution" model and a 15x15 "OOD Transfer" model, as training examples increase from 0 to 240. The 10x10 model consistently outperforms the 15x15 model, with both showing improvement as training data grows. Shaded regions around each line likely represent confidence intervals or variability in performance.
### Components/Axes
- **X-Axis (Training Examples)**: Ranges from 0 to 240 in increments of 30.
- **Y-Axis (Success Rate %)**: Ranges from 0 to 70 in increments of 10.
- **Legend**:
- Blue line: "10x10 (In-Distribution)"
- Orange line: "15x15 (OOD Transfer)"
- **Shaded Areas**: Surround both lines, indicating variability (e.g., ±2% for blue, ±5% for orange).
### Detailed Analysis
#### 10x10 (In-Distribution) Model (Blue Line)
- **Data Points**:
- 0 examples: 28%
- 30 examples: 52%
- 60 examples: 58%
- 90 examples: 58%
- 120 examples: 57%
- 150 examples: 57%
- 180 examples: 61%
- 210 examples: 56%
- 240 examples: 54%
- **Trend**: Steady upward trajectory from 28% to 61% (peak at 180 examples), followed by a slight decline. Success rate remains above 50% after 30 examples.
#### 15x15 (OOD Transfer) Model (Orange Line)
- **Data Points**:
- 0 examples: 9%
- 30 examples: 24%
- 60 examples: 38%
- 90 examples: 30%
- 120 examples: 49%
- 150 examples: 35%
- 180 examples: 32%
- 210 examples: 44%
- 240 examples: 44%
- **Trend**: Volatile performance with peaks at 120 (49%) and 210/240 examples (44%). Initial rise to 38% at 60 examples, followed by a dip to 30% at 90 examples.
### Key Observations
1. **Performance Gap**: The 10x10 model consistently achieves higher success rates (50–61% vs. 9–49%).
2. **Training Impact**: Both models improve with more examples, but the 10x10 model’s gains are more stable.
3. **Variability**: The 15x15 model’s shaded region is wider, suggesting greater uncertainty in its performance.
4. **Plateauing**: The 10x10 model plateaus near 60% after 180 examples, while the 15x15 model fluctuates without a clear plateau.
### Interpretation
The chart demonstrates that the 10x10 model generalizes better to in-distribution tasks, likely due to simpler architecture or better regularization. The 15x15 model’s lower success rate and higher variability suggest challenges in OOD transfer, possibly due to overfitting or insufficient training data. While both models benefit from increased training examples, the 10x10 model’s robustness makes it more reliable for practical applications. The 15x15 model’s peak at 120 examples hints at a potential "sweet spot" for OOD transfer, but its instability limits real-world utility.