## Line Graphs: Pigou's Network Performance Metrics
### Overview
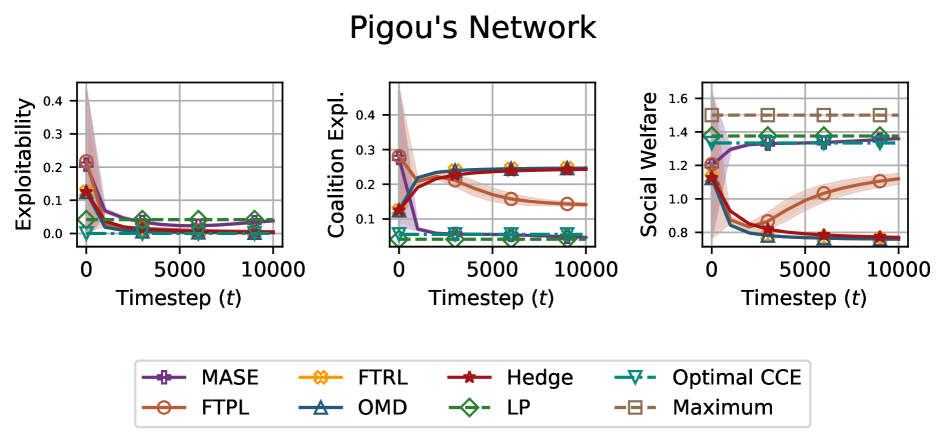
The image presents three line graphs comparing the performance of various strategies (MASE, FTRL, Hedge, FTPL, OMD, LP, Optimal CCE, Maximum) across three metrics: Exploitability, Coalition Explorability, and Social Welfare over 10,000 timesteps. Each graph uses distinct y-axis scales and color-coded lines with geometric markers.
### Components/Axes
1. **Main Title**: "Pigou's Network" (center top)
2. **Graphs**:
- **Left Graph**: Exploitability (y-axis: 0–0.4)
- **Middle Graph**: Coalition Explorability (y-axis: 0–0.4)
- **Right Graph**: Social Welfare (y-axis: 0–1.6)
3. **X-Axis**: Timestep (t) for all graphs (0–10,000)
4. **Legend**: Bottom center, mapping 8 strategies to colors/markers:
- MASE: Purple +
- FTRL: Orange ★
- Hedge: Red △
- FTPL: Brown ○
- OMD: Teal ▼
- LP: Green ◇
- Optimal CCE: Dark teal ▼
- Maximum: Brown □
### Detailed Analysis
1. **Exploitability Graph**:
- All lines start near 0.4 at t=0, dropping sharply within 5,000 timesteps.
- Stabilize between 0.05–0.1 by t=10,000.
- **Key Lines**:
- Hedge (red △): Lowest final value (~0.05)
- LP (green ◇): Slightly higher (~0.07)
- FTRL (orange ★): Highest (~0.12)
2. **Coalition Explorability Graph**:
- Lines start near 0, rise sharply within 5,000 timesteps.
- Stabilize between 0.1–0.25 by t=10,000.
- **Key Lines**:
- LP (green ◇): Highest (~0.25)
- Optimal CCE (dark teal ▼): ~0.18
- MASE (purple +): ~0.12
3. **Social Welfare Graph**:
- Lines start near 1.6, drop sharply within 5,000 timesteps.
- Stabilize between 0.8–1.4 by t=10,000.
- **Key Lines**:
- Maximum (brown □): Highest (~1.4)
- LP (green ◇): ~1.3
- Hedge (red △): ~0.9
### Key Observations
1. **Performance Trade-offs**:
- Strategies with lower Exploitability (Hedge, LP) often achieve higher Social Welfare.
- FTRL and FTPL show higher Exploitability but lower Social Welfare.
2. **Stability**:
- All metrics stabilize by ~5,000 timesteps, with minimal changes thereafter.
3. **Outliers**:
- Maximum strategy maintains highest Social Welfare but moderate Exploitability.
- Optimal CCE underperforms LP in Coalition Explorability despite similar Exploitability.
### Interpretation
The data suggests Pigou's Network strategies involve trade-offs between exploitation, coalition dynamics, and social welfare. Hedge and LP strategies appear most balanced, minimizing exploitation while maintaining coalition strength and social welfare. FTRL/FTPL prioritize exploration at the cost of social outcomes. The "Maximum" strategy achieves near-optimal Social Welfare but with higher exploitation than LP. This aligns with Pigouvian principles where optimal policies balance individual incentives with collective welfare, though no single strategy dominates all metrics. The Optimal CCE's underperformance in coalition dynamics warrants further investigation into its exploration mechanisms.