## Grouped Bar Chart: Unfaithfulness Rate by AI Model and Reasoning Type
### Overview
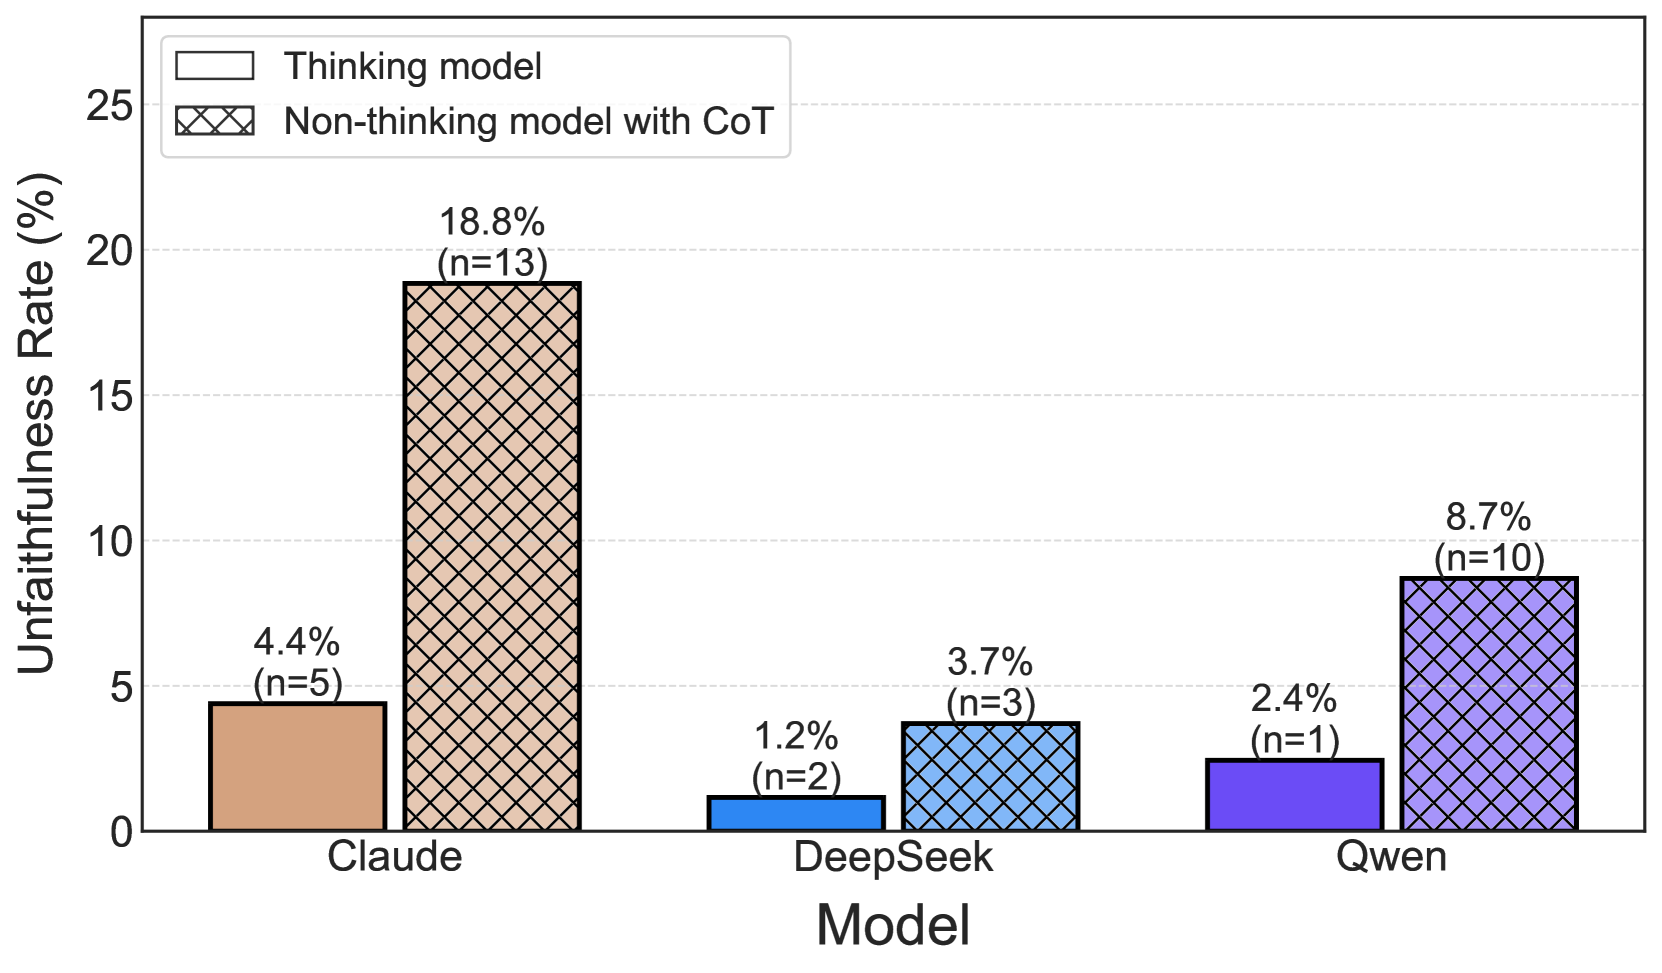
This image is a grouped bar chart comparing the "Unfaithfulness Rate (%)" of three different AI models (Claude, DeepSeek, Qwen). For each model, the chart displays two bars representing two different reasoning approaches: a "Thinking model" and a "Non-thinking model with CoT" (Chain-of-Thought). The chart includes specific percentage values and sample sizes (n) for each data point.
### Components/Axes
* **Chart Type:** Grouped Bar Chart.
* **X-Axis (Horizontal):** Labeled "Model". It lists three categorical models from left to right: **Claude**, **DeepSeek**, and **Qwen**.
* **Y-Axis (Vertical):** Labeled "Unfaithfulness Rate (%)". The scale runs from 0 to 25, with major gridlines at intervals of 5 (0, 5, 10, 15, 20, 25).
* **Legend:** Located in the top-left corner of the chart area.
* A solid, light-colored box corresponds to **"Thinking model"**.
* A box with a cross-hatch pattern corresponds to **"Non-thinking model with CoT"**.
* **Data Labels:** Each bar has a text label above it stating the exact percentage and the sample size in parentheses (e.g., "4.4% (n=5)").
### Detailed Analysis
The data is presented in three model groups, each containing two bars. The "Thinking model" bars are solid-colored, while the "Non-thinking model with CoT" bars have a cross-hatch pattern.
**1. Claude (Leftmost Group)**
* **Thinking model (Solid, light brown/tan bar):** Unfaithfulness Rate = **4.4%** (n=5).
* **Non-thinking model with CoT (Cross-hatched, light brown/tan bar):** Unfaithfulness Rate = **18.8%** (n=13).
* **Trend:** The non-thinking model with CoT shows a significantly higher unfaithfulness rate than the thinking model for Claude.
**2. DeepSeek (Center Group)**
* **Thinking model (Solid, medium blue bar):** Unfaithfulness Rate = **1.2%** (n=2).
* **Non-thinking model with CoT (Cross-hatched, medium blue bar):** Unfaithfulness Rate = **3.7%** (n=3).
* **Trend:** The non-thinking model with CoT has a higher unfaithfulness rate than the thinking model for DeepSeek, but both values are the lowest among the three models.
**3. Qwen (Rightmost Group)**
* **Thinking model (Solid, purple bar):** Unfaithfulness Rate = **2.4%** (n=1).
* **Non-thinking model with CoT (Cross-hatched, purple bar):** Unfaithfulness Rate = **8.7%** (n=10).
* **Trend:** The non-thinking model with CoT shows a higher unfaithfulness rate than the thinking model for Qwen.
### Key Observations
1. **Consistent Pattern:** For all three models (Claude, DeepSeek, Qwen), the "Non-thinking model with CoT" has a **higher unfaithfulness rate** than the corresponding "Thinking model."
2. **Magnitude of Difference:** The gap between the two reasoning types is largest for **Claude** (a difference of 14.4 percentage points) and smallest for **DeepSeek** (a difference of 2.5 percentage points).
3. **Overall Performance:** **DeepSeek** exhibits the lowest unfaithfulness rates for both reasoning types. **Claude's** non-thinking model with CoT has the highest single unfaithfulness rate on the chart (18.8%).
4. **Sample Size Variation:** The sample sizes (n) are small and vary significantly, from n=1 for Qwen's thinking model to n=13 for Claude's non-thinking model. This indicates high uncertainty, especially for the Qwen thinking model data point.
### Interpretation
The data suggests a clear relationship between the reasoning approach and the measured "unfaithfulness rate" for these specific AI models. In this context, "unfaithfulness" likely refers to a model generating outputs that are incorrect, fabricated, or not grounded in provided context or facts.
The key finding is that **enabling Chain-of-Thought (CoT) reasoning in a "non-thinking" model architecture is associated with a higher rate of unfaithfulness** compared to using a native "thinking" model architecture across all three tested models. This is a counter-intuitive result, as CoT is often employed to improve reasoning accuracy. The data implies that the architectural difference ("thinking" vs. "non-thinking") may be a more critical factor for faithfulness than the presence of an explicit CoT step in this evaluation.
The significant variation in sample sizes (n) is a major caveat. The result for Qwen's thinking model (2.4%, n=1) is particularly unreliable. The trend is consistent, but the absolute values, especially for Claude's non-thinking model, should be interpreted with caution due to the limited data. The chart demonstrates that model architecture and reasoning methodology interact in complex ways to affect output reliability.