# Technical Data Extraction: Submitted Prediction Analysis
This document provides a detailed extraction and analysis of two histograms comparing prediction outcomes based on "Total Steps" and "Cost (USD)".
## 1. General Metadata
* **Language:** English
* **Image Type:** Comparative Histograms (Stacked)
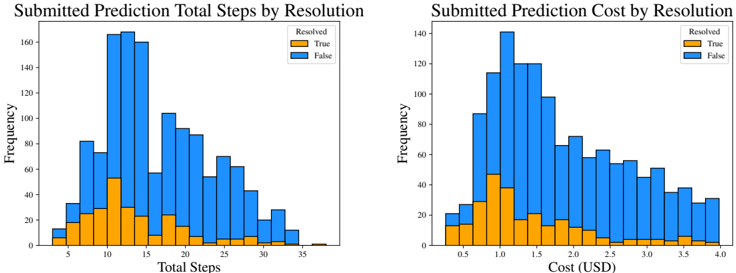
* **Primary Categories (Legend):**
* **Resolved: True** (Represented by **Orange** bars)
* **Resolved: False** (Represented by **Blue** bars)
* **Layout:** Two side-by-side charts sharing a common Y-axis label ("Frequency").
---
## 2. Chart 1: Submitted Prediction Total Steps by Resolution
### Component Isolation
* **Header:** Submitted Prediction Total Steps by Resolution
* **X-Axis Title:** Total Steps
* **Y-Axis Title:** Frequency
* **Legend Location:** Top right [x=0.85, y=0.90]
### Axis Markers
* **X-Axis:** 5, 10, 15, 20, 25, 30, 35
* **Y-Axis:** 0, 20, 40, 60, 80, 100, 120, 140, 160
### Data Trends and Observations
* **Overall Distribution:** The data is right-skewed, with a primary peak occurring between 10 and 15 steps.
* **Resolved (True - Orange):** This series shows a relatively low frequency across all step counts. It peaks early around 10-12 steps (approx. 55 frequency) and tapers off significantly after 20 steps.
* **Resolved (False - Blue):** This series dominates the frequency. It shows a bimodal distribution with a major peak between 10-15 steps (reaching ~170 frequency) and a secondary, smaller peak around 18-20 steps.
* **Key Data Point:** The highest total frequency occurs at approximately 13 steps, where the "False" resolution significantly outweighs the "True" resolution.
---
## 3. Chart 2: Submitted Prediction Cost by Resolution
### Component Isolation
* **Header:** Submitted Prediction Cost by Resolution
* **X-Axis Title:** Cost (USD)
* **Y-Axis Title:** Frequency
* **Legend Location:** Top right [x=0.85, y=0.90]
### Axis Markers
* **X-Axis:** 0.5, 1.0, 1.5, 2.0, 2.5, 3.0, 3.5, 4.0
* **Y-Axis:** 0, 20, 40, 60, 80, 100, 120, 140
### Data Trends and Observations
* **Overall Distribution:** The cost distribution is heavily right-skewed. The majority of predictions cost between $0.75 and $1.75 USD.
* **Resolved (True - Orange):** Successful resolutions are concentrated at the lower end of the cost spectrum. The peak frequency for "True" occurs around $0.90 - $1.00 USD (approx. 48 frequency). As cost increases beyond $2.00, the frequency of "True" resolutions becomes negligible.
* **Resolved (False - Blue):** Unsuccessful resolutions follow a similar initial curve but maintain a much higher frequency across the entire cost range. The peak occurs at approximately $1.10 USD (reaching ~140 frequency).
* **Key Data Point:** There is a long tail for "False" resolutions extending all the way to $4.00 USD, whereas "True" resolutions almost entirely disappear after the $3.50 mark.
---
## 4. Comparative Summary
| Metric | Peak Frequency Range | Success (True) Trend | Failure (False) Trend |
| :--- | :--- | :--- | :--- |
| **Total Steps** | 10 - 15 Steps | Low, peaks early at ~11 steps. | High, bimodal peaks at ~13 and ~19 steps. |
| **Cost (USD)** | $0.80 - $1.50 | Concentrated under $1.50. | Dominates all price points; long tail to $4.00. |
**Conclusion:** Both charts indicate that "False" resolutions (failures) are significantly more frequent than "True" resolutions (successes) across all measured steps and costs. Success is most likely to occur at lower step counts (approx. 10) and lower costs (approx. $1.00).