## Bar Charts: Submitted Prediction Total Steps and Cost by Resolution
### Overview
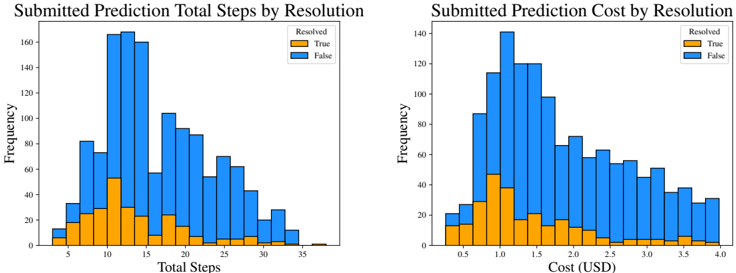
The image contains two adjacent bar charts comparing the frequency distribution of submitted predictions based on resolution status. The left chart shows **Total Steps** (x-axis) and the right chart shows **Cost (USD)** (x-axis), both segmented by **Resolved (True)** and **False** predictions (y-axis frequency).
---
### Components/Axes
1. **Left Chart: Submitted Prediction Total Steps by Resolution**
- **X-axis (Total Steps)**: Discrete intervals from 5 to 35 steps, labeled at 5, 10, 15, 20, 25, 30, 35.
- **Y-axis (Frequency)**: Linear scale from 0 to 160, incrementing by 20.
- **Legend**:
- **Resolved (True)**: Orange bars.
- **False**: Blue bars.
- **Legend Position**: Top-right corner of the chart.
2. **Right Chart: Submitted Prediction Cost by Resolution**
- **X-axis (Cost)**: Continuous scale from 0.5 to 4.0 USD, labeled at 0.5, 1.0, 1.5, 2.0, 2.5, 3.0, 3.5, 4.0.
- **Y-axis (Frequency)**: Linear scale from 0 to 140, incrementing by 20.
- **Legend**: Same as left chart (orange for Resolved, blue for False).
- **Legend Position**: Top-right corner of the chart.
---
### Detailed Analysis
#### Left Chart: Total Steps
- **Resolved (True)**:
- Peaks at **15 steps** with a frequency of ~50.
- Frequencies decline sharply after 15 steps, with minimal counts beyond 25 steps.
- Lowest frequencies observed at 5 steps (~10) and 35 steps (~2).
- **False**:
- Dominates across all step ranges, with the highest frequency at **10 steps** (~140).
- Frequencies decrease gradually, with ~80 at 20 steps and ~40 at 30 steps.
- Minimal presence at 5 steps (~20) and 35 steps (~10).
#### Right Chart: Cost (USD)
- **Resolved (True)**:
- Peaks at **$1.00** with a frequency of ~45.
- Frequencies decline after $1.00, with ~20 at $2.00 and ~5 at $4.00.
- Lowest frequencies at $0.50 (~10) and $3.50 (~5).
- **False**:
- Peaks at **$1.50** with a frequency of ~120.
- Frequencies drop to ~60 at $2.00 and ~30 at $3.00.
- Minimal presence at $0.50 (~20) and $4.00 (~10).
---
### Key Observations
1. **Resolution Efficiency**:
- Resolved predictions cluster around **15 steps** and **$1.00**, indicating optimal performance.
- False predictions require fewer steps (peak at 10) but higher cost (peak at $1.50), suggesting inefficiency in resolution.
2. **Distribution Trends**:
- Resolved predictions show a unimodal distribution for both steps and cost.
- False predictions exhibit a broader distribution, with higher variability in cost.
3. **Outliers**:
- Resolved predictions at 35 steps and $4.00 are rare (~2 and ~5, respectively).
- False predictions at 35 steps (~10) and $4.00 (~10) are slightly more common but still low-frequency.
---
### Interpretation
The data highlights a clear distinction between resolved and unresolved predictions:
- **Resolved predictions** are more resource-efficient, concentrating around moderate steps and cost. This suggests effective resolution mechanisms for these cases.
- **False predictions** incur higher costs despite requiring fewer steps, possibly due to manual intervention or rework. The peak at $1.50 may reflect a threshold for automated correction attempts before escalation.
- The decline in frequency for resolved predictions at higher steps/costs implies that complex cases are either resolved less frequently or require specialized handling.
These insights could inform process optimization, such as refining algorithms to reduce false predictions or allocating resources more effectively for high-cost cases.