\n
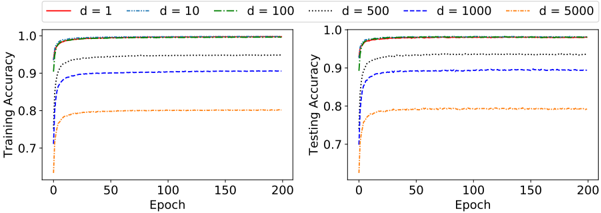
## Comparative Line Charts: Training and Testing Accuracy vs. Epoch for Different Model Dimensions (d)
### Overview
The image displays two side-by-side line charts comparing the training and testing accuracy of a model over 200 training epochs. The comparison is made across six different values of a parameter labeled 'd' (likely representing model dimension, width, or a similar hyperparameter). The charts illustrate how model performance on training and validation data evolves with training time and varies with model capacity.
### Components/Axes
* **Chart Layout:** Two subplots arranged horizontally.
* **Left Subplot Title/Label:** Y-axis is labeled "Training Accuracy".
* **Right Subplot Title/Label:** Y-axis is labeled "Testing Accuracy".
* **Shared X-Axis:** Both subplots share an X-axis labeled "Epoch", ranging from 0 to 200 with major ticks at 0, 50, 100, 150, and 200.
* **Y-Axis Scale:** Both Y-axes range from approximately 0.65 to 1.0, with major ticks at 0.7, 0.8, 0.9, and 1.0.
* **Legend:** Positioned centrally at the top of the image, spanning both subplots. It defines six data series:
* `d = 1`: Solid red line.
* `d = 10`: Dashed blue line (`--`).
* `d = 100`: Dash-dot green line (`-.`).
* `d = 500`: Dotted black line (`:`).
* `d = 1000`: Dashed dark blue line (`--`).
* `d = 5000`: Dash-dot orange line (`-.`).
### Detailed Analysis
**Left Chart - Training Accuracy:**
* **Trend Verification:** All six lines show a steep initial increase in accuracy within the first ~10-20 epochs, followed by a plateau. The final plateau level is inversely related to the value of 'd'.
* **Data Series & Approximate Values:**
* `d = 1` (Red, Solid): Starts near 0.95, rapidly approaches and plateaus very close to **1.0**.
* `d = 10` (Blue, Dashed): Starts near 0.90, plateaus near **~0.99**.
* `d = 100` (Green, Dash-Dot): Starts near 0.85, plateaus near **~0.98**.
* `d = 500` (Black, Dotted): Starts near 0.80, plateaus near **~0.95**.
* `d = 1000` (Dark Blue, Dashed): Starts near 0.75, plateaus near **~0.90**.
* `d = 5000` (Orange, Dash-Dot): Starts near 0.65, plateaus near **~0.80**.
**Right Chart - Testing Accuracy:**
* **Trend Verification:** Similar initial steep rise for all lines, followed by a plateau. However, the final plateau levels are significantly lower than their training counterparts, especially for larger 'd' values. The ordering of final performance is the same as in training (lower 'd' achieves higher accuracy).
* **Data Series & Approximate Values:**
* `d = 1` (Red, Solid): Plateaus near **~0.98**.
* `d = 10` (Blue, Dashed): Plateaus near **~0.97**.
* `d = 100` (Green, Dash-Dot): Plateaus near **~0.96**.
* `d = 500` (Black, Dotted): Plateaus near **~0.93**.
* `d = 1000` (Dark Blue, Dashed): Plateaus near **~0.90**.
* `d = 5000` (Orange, Dash-Dot): Plateaus near **~0.79**.
### Key Observations
1. **Performance Gap:** A clear gap exists between training and testing accuracy for all models, which widens dramatically as 'd' increases. For `d=1`, the gap is minimal (~0.02). For `d=5000`, the gap is very large (~0.01 training vs. ~0.79 testing).
2. **Convergence Speed:** All models converge (reach their plateau) relatively quickly, within the first 25-50 epochs. Further training beyond epoch 50 yields negligible improvement.
3. **Monotonic Relationship:** There is a strict monotonic relationship: as 'd' increases, both final training accuracy and final testing accuracy decrease.
4. **Overfitting Indicator:** The combination of high training accuracy and lower testing accuracy for large 'd' values is a classic visual indicator of overfitting. The model with high capacity (`d=5000`) memorizes the training data well but generalizes poorly.
### Interpretation
This visualization demonstrates the **bias-variance tradeoff** in machine learning.
* **Low 'd' (e.g., d=1, 10):** Represents a simpler model with lower capacity (high bias). It underfits slightly, as seen by its inability to reach perfect training accuracy, but it generalizes well to unseen test data, resulting in a small generalization gap.
* **High 'd' (e.g., d=1000, 5000):** Represents a complex model with high capacity (high variance). It can fit the training data almost perfectly (low bias), but it learns noise or specific patterns not present in the broader data distribution. This leads to poor generalization and a large generalization gap, which is the definition of overfitting.
* **Practical Implication:** The charts suggest that for this specific task and dataset, a model with an intermediate dimension (perhaps around `d=100` or `d=500`) offers the best compromise, achieving high testing accuracy without severe overfitting. Simply increasing model size (`d`) beyond a certain point is detrimental to real-world performance. The rapid convergence also indicates that extensive training beyond 50 epochs may be unnecessary, saving computational resources.