## Line Graph: Training and Testing Accuracy vs. Epochs
### Overview
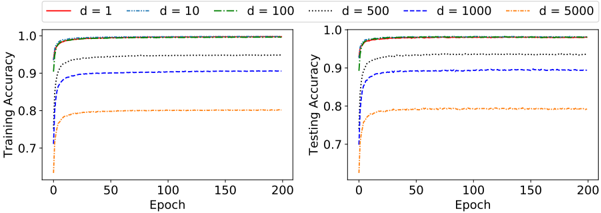
The image contains two line graphs side-by-side, comparing **Training Accuracy** (left) and **Testing Accuracy** (right) across 200 epochs. Each graph displays six data series representing different values of a parameter `d` (likely model complexity or depth), ranging from `d = 1` to `d = 5000`. Accuracy values are plotted on the y-axis (0.7–1.0), and epochs on the x-axis (0–200). Both graphs share identical legends and axis labels.
---
### Components/Axes
- **X-Axis (Epochs)**: Labeled "Epoch" with ticks at 0, 50, 100, 150, 200.
- **Y-Axis (Accuracy)**: Labeled "Training Accuracy" (left) and "Testing Accuracy" (right), scaled from 0.7 to 1.0.
- **Legends**:
- Located at the top of each panel.
- Colors/styles correspond to `d` values:
- `d = 1`: Solid red
- `d = 10`: Dashed blue
- `d = 100`: Dash-dot green
- `d = 500`: Dotted gray
- `d = 1000`: Dash-dot blue
- `d = 5000`: Dotted orange
---
### Detailed Analysis
#### Training Accuracy (Left Panel)
- **Trends**:
- All lines show rapid initial improvement, plateauing by ~50 epochs.
- Higher `d` values (e.g., `d = 5000`) start lower and plateau at lower accuracy (~0.78).
- Lower `d` values (e.g., `d = 1`) achieve higher plateaus (~0.95).
- **Key Data Points**:
- `d = 1`: Peaks at ~0.95 by 50 epochs.
- `d = 5000`: Peaks at ~0.78 by 50 epochs.
#### Testing Accuracy (Right Panel)
- **Trends**:
- Similar shape to training accuracy but with slightly lower plateaus.
- `d = 1` and `d = 10` achieve ~0.93, while `d = 5000` plateaus at ~0.79.
- Lines converge as epochs increase, indicating diminishing returns.
---
### Key Observations
1. **Performance Degradation with Higher `d`**:
- Accuracy decreases as `d` increases, suggesting overfitting or excessive complexity.
- `d = 1` and `d = 10` outperform larger `d` values in both training and testing.
2. **Convergence of Curves**:
- All lines flatten after ~50 epochs, indicating saturation of model capacity.
3. **Testing vs. Training Gap**:
- Testing accuracy is consistently ~0.02–0.03 lower than training accuracy, hinting at mild overfitting for smaller `d` values.
---
### Interpretation
The data demonstrates a trade-off between model complexity (`d`) and generalization performance. Lower `d` values (`d = 1`, `d = 10`) achieve higher accuracy on both training and testing datasets, while larger `d` values (e.g., `d = 5000`) underperform, likely due to overfitting. The convergence of curves after 50 epochs suggests that further training provides minimal benefit, emphasizing the importance of early stopping or regularization. The slight gap between training and testing accuracy for smaller `d` values indicates a need for careful validation to avoid overfitting. This analysis aligns with principles of model selection in machine learning, where simplicity often balances performance and generalizability.