## Bar Charts: Node Degree Distribution in Bitcoin-Alpha and Slashdot Networks
### Overview
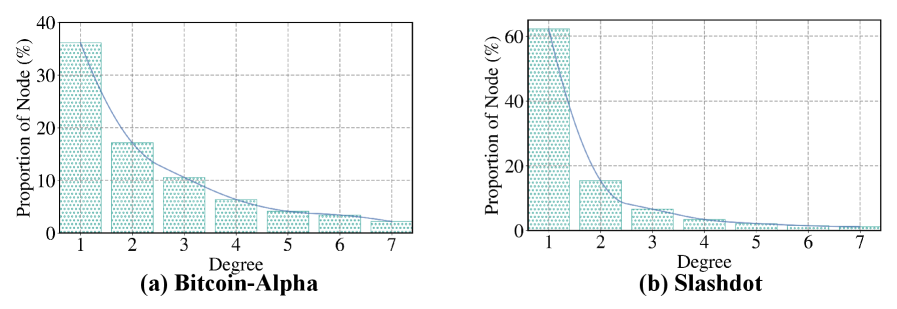
The image presents two bar charts comparing the distribution of node degrees in the Bitcoin-Alpha and Slashdot networks. Each chart displays the proportion of nodes (in percentage) for each degree value, ranging from 1 to 7. A curve is overlaid on each bar chart, visually representing the trend of the distribution.
### Components/Axes
**Left Chart (Bitcoin-Alpha):**
* **Title:** (a) Bitcoin-Alpha
* **X-axis:** Degree (values: 1, 2, 3, 4, 5, 6, 7)
* **Y-axis:** Proportion of Node (%) (values: 0, 10, 20, 30, 40)
* **Bars:** Represent the proportion of nodes for each degree. The bars are light blue.
* **Curve:** A light blue curve overlays the bars, showing the general trend.
**Right Chart (Slashdot):**
* **Title:** (b) Slashdot
* **X-axis:** Degree (values: 1, 2, 3, 4, 5, 6, 7)
* **Y-axis:** Proportion of Node (%) (values: 0, 20, 40, 60)
* **Bars:** Represent the proportion of nodes for each degree. The bars are light blue.
* **Curve:** A light blue curve overlays the bars, showing the general trend.
### Detailed Analysis
**Bitcoin-Alpha:**
* **Degree 1:** Proportion of nodes is approximately 36%.
* **Degree 2:** Proportion of nodes is approximately 17%.
* **Degree 3:** Proportion of nodes is approximately 11%.
* **Degree 4:** Proportion of nodes is approximately 7%.
* **Degree 5:** Proportion of nodes is approximately 5%.
* **Degree 6:** Proportion of nodes is approximately 3%.
* **Degree 7:** Proportion of nodes is approximately 3%.
The curve shows a decreasing trend, indicating that the proportion of nodes decreases as the degree increases.
**Slashdot:**
* **Degree 1:** Proportion of nodes is approximately 63%.
* **Degree 2:** Proportion of nodes is approximately 16%.
* **Degree 3:** Proportion of nodes is approximately 6%.
* **Degree 4:** Proportion of nodes is approximately 3%.
* **Degree 5:** Proportion of nodes is approximately 2%.
* **Degree 6:** Proportion of nodes is approximately 1%.
* **Degree 7:** Proportion of nodes is approximately 1%.
The curve shows a decreasing trend, indicating that the proportion of nodes decreases as the degree increases.
### Key Observations
* Both networks exhibit a similar trend: the proportion of nodes decreases as the degree increases.
* The Slashdot network has a significantly higher proportion of nodes with degree 1 compared to the Bitcoin-Alpha network.
* The Bitcoin-Alpha network has a more gradual decrease in the proportion of nodes as the degree increases, compared to Slashdot.
### Interpretation
The charts illustrate the degree distribution of nodes in the Bitcoin-Alpha and Slashdot networks. The data suggests that both networks follow a power-law-like distribution, where a small number of nodes have a high degree, and a large number of nodes have a low degree. The Slashdot network appears to be more heavily skewed towards nodes with a degree of 1, indicating a more centralized structure compared to the Bitcoin-Alpha network. This could be due to differences in the network's purpose, user behavior, or underlying architecture. The decreasing trend in both networks highlights the common characteristic of many real-world networks, where most nodes have relatively few connections, and only a few nodes have many connections.