# Technical Data Extraction: Node Degree Distribution Analysis
This document contains a detailed extraction of data from two side-by-side bar charts illustrating the proportion of nodes relative to their degree in two different datasets: **Bitcoin-Alpha** and **Slashdot**.
## 1. General Layout and Components
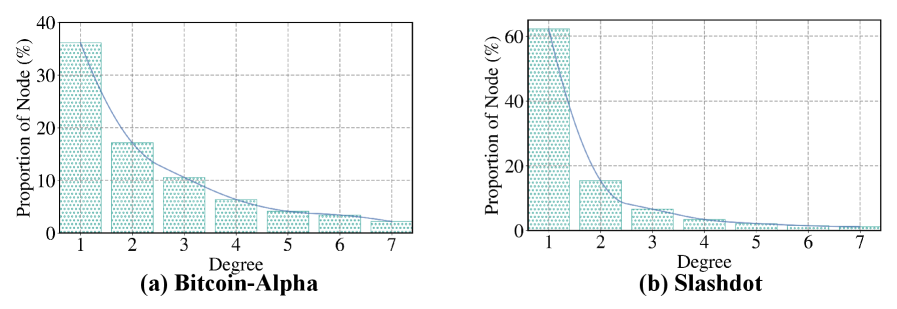
The image consists of two sub-figures, labeled (a) and (b), arranged horizontally.
* **Y-Axis (Common):** "Proportion of Node (%)" representing the percentage of the total network nodes.
* **X-Axis (Common):** "Degree" representing the number of connections per node, ranging from 1 to 7.
* **Visual Elements:**
* **Bars:** Light teal/cyan bars with a dotted texture representing discrete data points.
* **Trend Line:** A solid blue-grey line overlaid on the bars to show the continuous decay trend.
* **Grid:** A dashed grey grid is present in the background of both charts.
---
## 2. Chart (a) Bitcoin-Alpha
**Sub-caption:** (a) Bitcoin-Alpha
### Trend Analysis
The data follows a power-law or exponential decay distribution. The proportion of nodes is highest at Degree 1 and decreases significantly as the degree increases. The slope is steepest between Degree 1 and 2, gradually flattening out as it approaches Degree 7.
### Data Point Extraction
| Degree (X) | Estimated Proportion of Nodes (%) |
| :--- | :--- |
| 1 | ~36% |
| 2 | ~17% |
| 3 | ~11% |
| 4 | ~7% |
| 5 | ~4% |
| 6 | ~3.5% |
| 7 | ~2% |
---
## 3. Chart (b) Slashdot
**Sub-caption:** (b) Slashdot
### Trend Analysis
Similar to the Bitcoin-Alpha dataset, this chart shows a heavy-tailed distribution. However, the concentration at Degree 1 is much more pronounced (over 60%), indicating a higher "sparsity" or a larger number of peripheral nodes compared to the Bitcoin-Alpha network. The drop-off after Degree 1 is extremely sharp.
### Data Point Extraction
| Degree (X) | Estimated Proportion of Nodes (%) |
| :--- | :--- |
| 1 | ~63% |
| 2 | ~15% |
| 3 | ~7% |
| 4 | ~4% |
| 5 | ~2% |
| 6 | ~1.5% |
| 7 | ~1% |
---
## 4. Comparative Summary
* **Dominance of Low Degree:** In both datasets, nodes with a degree of 1 are the most common.
* **Concentration Difference:** The Slashdot dataset is significantly more skewed toward low-degree nodes, with Degree 1 nodes accounting for roughly 63% of the network, whereas in Bitcoin-Alpha, they account for approximately 36%.
* **Decay Rate:** The "long tail" of the distribution is visible in both, but the Bitcoin-Alpha network shows a more gradual decline in node proportion as degree increases compared to the rapid drop seen in Slashdot.