## Bar Charts with Overlaid Line Graphs: Node Degree Distributions
### Overview
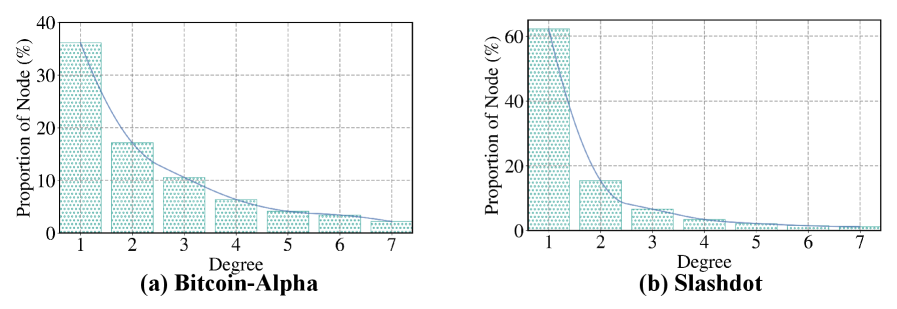
The image displays two side-by-side bar charts, each overlaid with a line graph. They illustrate the distribution of node degrees (number of connections) within two different networks: "Bitcoin-Alpha" and "Slashdot". Both charts show a classic "long-tail" or power-law distribution, where a large proportion of nodes have a low degree, and a very small proportion have a high degree.
### Components/Axes
* **Chart Layout:** Two charts arranged horizontally.
* **Chart (a) Title:** "(a) Bitcoin-Alpha" (centered below the chart).
* **Chart (b) Title:** "(b) Slashdot" (centered below the chart).
* **X-Axis (Both Charts):**
* **Label:** "Degree"
* **Scale:** Linear, with integer markers from 1 to 7.
* **Y-Axis (Both Charts):**
* **Label:** "Proportion of Node (%)"
* **Scale:** Linear, percentage.
* **Chart (a) Range:** 0 to 40, with major ticks at 0, 10, 20, 30, 40.
* **Chart (b) Range:** 0 to 60, with major ticks at 0, 20, 40, 60.
* **Data Series:**
* **Bars:** Represent the proportion of nodes at each specific degree. They are filled with a light blue color and a dotted pattern.
* **Line:** A solid, darker blue line that connects the top-center of each bar, visualizing the overall distribution trend.
* **Legend:** Not explicitly present. The bar and line represent the same data series (proportion per degree).
### Detailed Analysis
**Chart (a) Bitcoin-Alpha:**
* **Trend:** The line slopes steeply downward from left to right, indicating a rapid decrease in node proportion as degree increases.
* **Data Points (Approximate):**
* Degree 1: ~35%
* Degree 2: ~18%
* Degree 3: ~10%
* Degree 4: ~6%
* Degree 5: ~4%
* Degree 6: ~3%
* Degree 7: ~2%
**Chart (b) Slashdot:**
* **Trend:** The line shows an even steeper initial decline than chart (a), dropping sharply from degree 1 to degree 2, then continuing to decline.
* **Data Points (Approximate):**
* Degree 1: ~60%
* Degree 2: ~15%
* Degree 3: ~8%
* Degree 4: ~4%
* Degree 5: ~2%
* Degree 6: ~1%
* Degree 7: <1%
### Key Observations
1. **Dominance of Low-Degree Nodes:** In both networks, the vast majority of nodes have a very low degree (1 or 2). For Slashdot, over half of all nodes (≈60%) have a degree of exactly 1.
2. **Steep Drop-off:** The proportion of nodes falls off dramatically after the first degree. The drop from degree 1 to degree 2 is particularly severe in the Slashdot network (≈60% to ≈15%).
3. **Long Tail:** Both distributions have a "long tail" extending to higher degrees (up to 7 shown), but the proportion of nodes in this tail is very small (single-digit percentages).
4. **Relative Scale:** The Slashdot network exhibits a more extreme concentration of nodes at the lowest degree compared to Bitcoin-Alpha.
### Interpretation
These charts are visualizing the **degree distribution** of two social or trust networks. A power-law distribution like this is a hallmark of **scale-free networks**.
* **What it suggests:** The data demonstrates that both the Bitcoin-Alpha (likely a trust network from a Bitcoin trading platform) and Slashdot (a technology news site with a friend/foe linking system) networks are highly centralized in terms of connectivity. A tiny minority of "hub" nodes have many connections, while the overwhelming majority of nodes are peripheral with only one or two links.
* **How elements relate:** The bar chart provides the precise proportion for each discrete degree, while the overlaid line graph emphasizes the continuous, decaying nature of the distribution. The steeper curve for Slashdot indicates its network structure is even more centralized around a few hubs than Bitcoin-Alpha.
* **Notable Anomalies/Patterns:** There are no anomalies; the charts show a textbook example of a skewed distribution common in real-world networks. The key pattern is the **extreme inequality in connectivity**. This structure has implications for network resilience (robust to random failure but vulnerable to targeted attacks on hubs) and information spread (hubs can disseminate information rapidly). The investigation here is **deductive**: starting from the observed visual pattern (steep curve) and applying network theory to infer the underlying structural properties of the systems being measured.