## Bar Chart: Ratios of Failed Problems of Base Model, SFT Model, and Initial RL Model in MATH-12k
### Overview
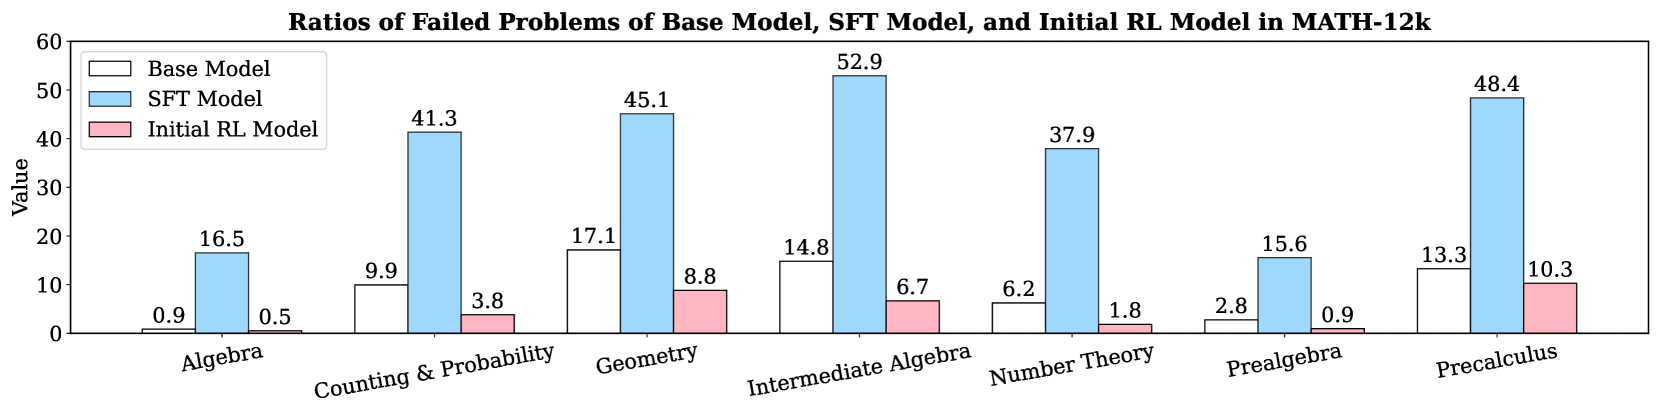
The chart compares the failure ratios of three models (Base Model, SFT Model, Initial RL Model) across seven math topics in the MATH-12k dataset. The y-axis represents failure ratios (0–60), while the x-axis lists math topics. Each topic has three grouped bars corresponding to the models.
### Components/Axes
- **X-axis (Categories)**: Algebra, Counting & Probability, Geometry, Intermediate Algebra, Number Theory, Prealgebra, Precalculus.
- **Y-axis (Value)**: Failure ratios (0–60).
- **Legend**:
- White = Base Model
- Blue = SFT Model
- Pink = Initial RL Model
- **Legend Position**: Top-left corner.
- **Bar Grouping**: Clustered bars per topic, with colors matching the legend.
### Detailed Analysis
| Topic | Base Model | SFT Model | Initial RL Model |
|------------------------|------------|-----------|------------------|
| Algebra | 0.9 | 16.5 | 0.5 |
| Counting & Probability | 9.9 | 41.3 | 3.8 |
| Geometry | 17.1 | 45.1 | 8.8 |
| Intermediate Algebra | 14.8 | 52.9 | 6.7 |
| Number Theory | 6.2 | 37.9 | 1.8 |
| Prealgebra | 2.8 | 15.6 | 0.9 |
| Precalculus | 13.3 | 48.4 | 10.3 |
### Key Observations
- **SFT Model Dominance**: The SFT Model consistently has the highest failure ratios across all topics, with peaks in Intermediate Algebra (52.9) and Precalculus (48.4).
- **Base Model Variability**: The Base Model shows mixed performance, with higher failure rates in Geometry (17.1) and Precalculus (13.3) compared to other topics.
- **Initial RL Model**: Generally the lowest failure ratios, except in Geometry (8.8) and Precalculus (10.3), where it surpasses the Base Model.
- **Outliers**:
- Intermediate Algebra has the highest SFT failure ratio (52.9).
- Geometry has the highest Base Model failure ratio (17.1).
### Interpretation
The data suggests that the SFT Model struggles most with Intermediate Algebra and Precalculus, potentially due to complex problem structures in these topics. The Base Model’s higher failure rates in Geometry and Precalculus may indicate limitations in handling spatial reasoning or advanced concepts. The Initial RL Model’s lower failure ratios overall suggest it is more robust, though its performance in Geometry and Precalculus warrants further investigation. The stark contrast between SFT and RL models highlights potential trade-offs between model complexity and reliability in specific domains.