## Histograms: Distribution of Shortest Path Lengths (sampled)
### Overview
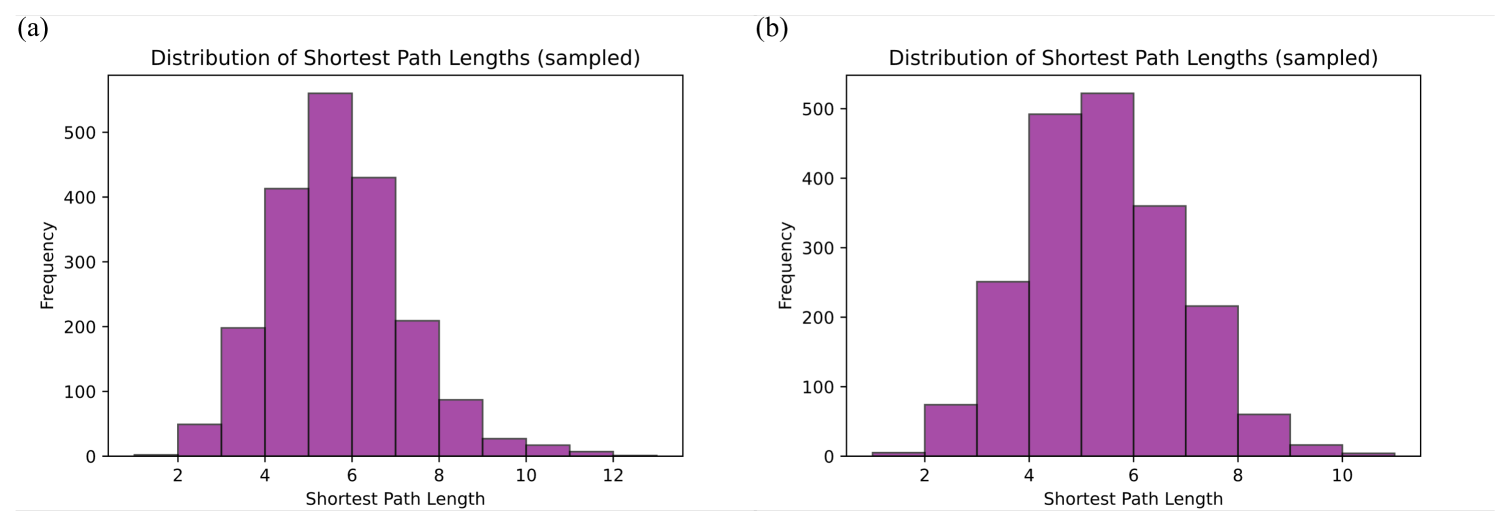
Two side-by-side histograms compare the frequency distribution of shortest path lengths in sampled data. Both use purple bars and share identical axis labels but differ in x-axis range and frequency distribution patterns.
### Components/Axes
- **X-axis (Horizontal):**
- Labeled "Shortest Path Length"
- Histogram (a): Range 2–12 (discrete intervals)
- Histogram (b): Range 2–10 (discrete intervals)
- **Y-axis (Vertical):**
- Labeled "Frequency"
- Scale: 0–550 (approximate maximum)
- **Legend:** Not explicitly visible in the image.
- **Bar Color:** Uniform purple across both histograms.
### Detailed Analysis
#### Histogram (a)
- **Peak Frequency:** ~550 at x=6
- **Secondary Peaks:**
- x=5: ~420
- x=7: ~430
- **Decline Pattern:** Gradual decrease after x=7, with minor fluctuations.
- **Low-Frequency Tails:**
- x=2: ~50
- x=12: ~5 (extreme tail)
#### Histogram (b)
- **Peak Frequency:** ~550 at x=5
- **Secondary Peaks:**
- x=4: ~250
- x=6: ~380
- **Decline Pattern:** Steeper drop after x=6 compared to (a).
- **Low-Frequency Tails:**
- x=2: ~10
- x=10: ~10 (extreme tail)
### Key Observations
1. **Similarity:** Both histograms share a central peak near the midpoint of their x-axis ranges (6 for (a), 5 for (b)).
2. **Divergence:**
- (a) exhibits a broader distribution with a longer right tail (up to x=12).
- (b) has a narrower distribution, with frequencies declining more sharply beyond x=6.
3. **Frequency Magnitude:** Both histograms reach identical maximum frequencies (~550), suggesting comparable sample sizes or normalization.
### Interpretation
The distributions likely represent shortest path lengths in two distinct networks or subsamples. The central peaks indicate that most paths cluster around moderate lengths (5–7), while the tails suggest rare occurrences of very short (x=2) or very long paths (x=10–12). The broader distribution in (a) may reflect a more heterogeneous network structure, whereas (b)'s sharper decline implies tighter path length constraints. The identical peak frequencies raise questions about sampling methodology—whether the data was normalized or if both samples share identical population characteristics.