## Line Chart: Performance Score vs. Compute
### Overview
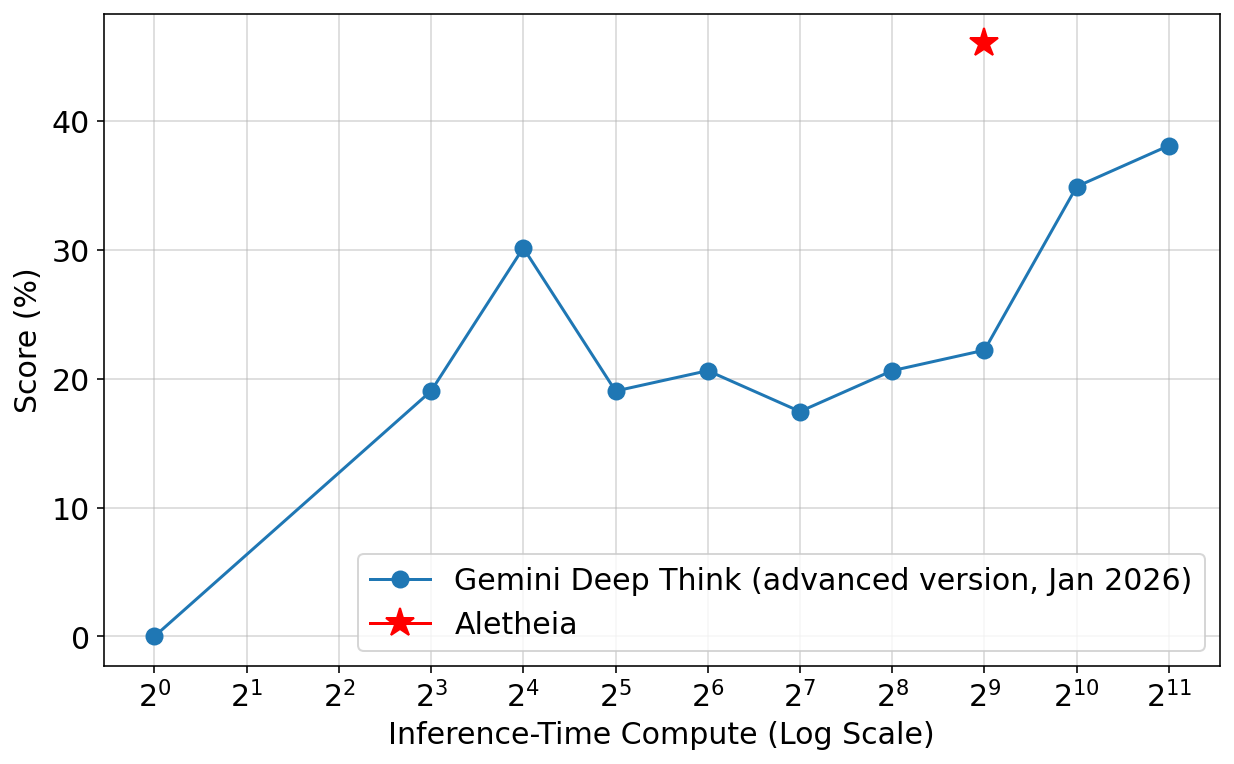
This image presents a line chart comparing the performance score of two models, "Gemini Deep Think (advanced version, Jan 2026)" and "Aletheia", against the Inference-Time Compute. The x-axis represents the Inference-Time Compute on a logarithmic scale, while the y-axis represents the Score in percentage.
### Components/Axes
* **X-axis Title:** Inference-Time Compute (Log Scale)
* **X-axis Scale:** Logarithmic, ranging from 2<sup>0</sup> to 2<sup>11</sup>. Markers are present at integer powers of 2.
* **Y-axis Title:** Score (%)
* **Y-axis Scale:** Linear, ranging from 0 to 40, with increments of 10.
* **Legend:** Located in the bottom-right corner.
* **Gemini Deep Think (advanced version, Jan 2026):** Represented by a blue line with circular markers.
* **Aletheia:** Represented by a red star marker.
### Detailed Analysis
**Gemini Deep Think (advanced version, Jan 2026) - Blue Line:**
The blue line shows an overall upward trend, but with fluctuations.
* At 2<sup>0</sup> (1), the score is approximately 1%.
* At 2<sup>1</sup> (2), the score is approximately 3%.
* At 2<sup>2</sup> (4), the score is approximately 12%.
* At 2<sup>3</sup> (8), the score is approximately 19%.
* At 2<sup>4</sup> (16), the score is approximately 31%.
* At 2<sup>5</sup> (32), the score is approximately 22%.
* At 2<sup>6</sup> (64), the score is approximately 17%.
* At 2<sup>7</sup> (128), the score is approximately 18%.
* At 2<sup>8</sup> (256), the score is approximately 22%.
* At 2<sup>9</sup> (512), the score is approximately 42%.
* At 2<sup>10</sup> (1024), the score is approximately 35%.
* At 2<sup>11</sup> (2048), the score is approximately 37%.
**Aletheia - Red Star:**
The red star represents a single data point.
* At 2<sup>9</sup> (512), the score is approximately 43%.
### Key Observations
* Aletheia achieves a higher score (approximately 43%) than Gemini Deep Think at the compute level of 2<sup>9</sup> (512).
* Gemini Deep Think demonstrates a generally increasing trend in score as compute increases, but with some dips.
* Gemini Deep Think's score at 2<sup>4</sup> (16) is significantly higher than at 2<sup>5</sup> (32), indicating a potential anomaly or non-linear relationship.
* The logarithmic scale on the x-axis suggests that the impact of compute on performance diminishes at higher compute levels.
### Interpretation
The chart compares the performance of two AI models as a function of computational resources used during inference. Gemini Deep Think shows a positive correlation between compute and performance, but with some variability. Aletheia, represented by a single point, outperforms Gemini Deep Think at a specific compute level (2<sup>9</sup>). This could indicate that Aletheia is more efficient at that particular compute level, or that it has a different architectural advantage. The fluctuations in Gemini Deep Think's performance suggest that the relationship between compute and performance is not strictly linear, and may be influenced by other factors. The use of a logarithmic scale for compute implies that the benefits of increasing compute diminish as the compute level increases, which is a common phenomenon in machine learning. The chart suggests that while increasing compute generally improves performance, there may be diminishing returns and that alternative approaches (like Aletheia’s) could offer better performance at specific compute levels.