## Line Chart: Inference-Time Compute vs. Score Percentage
### Overview
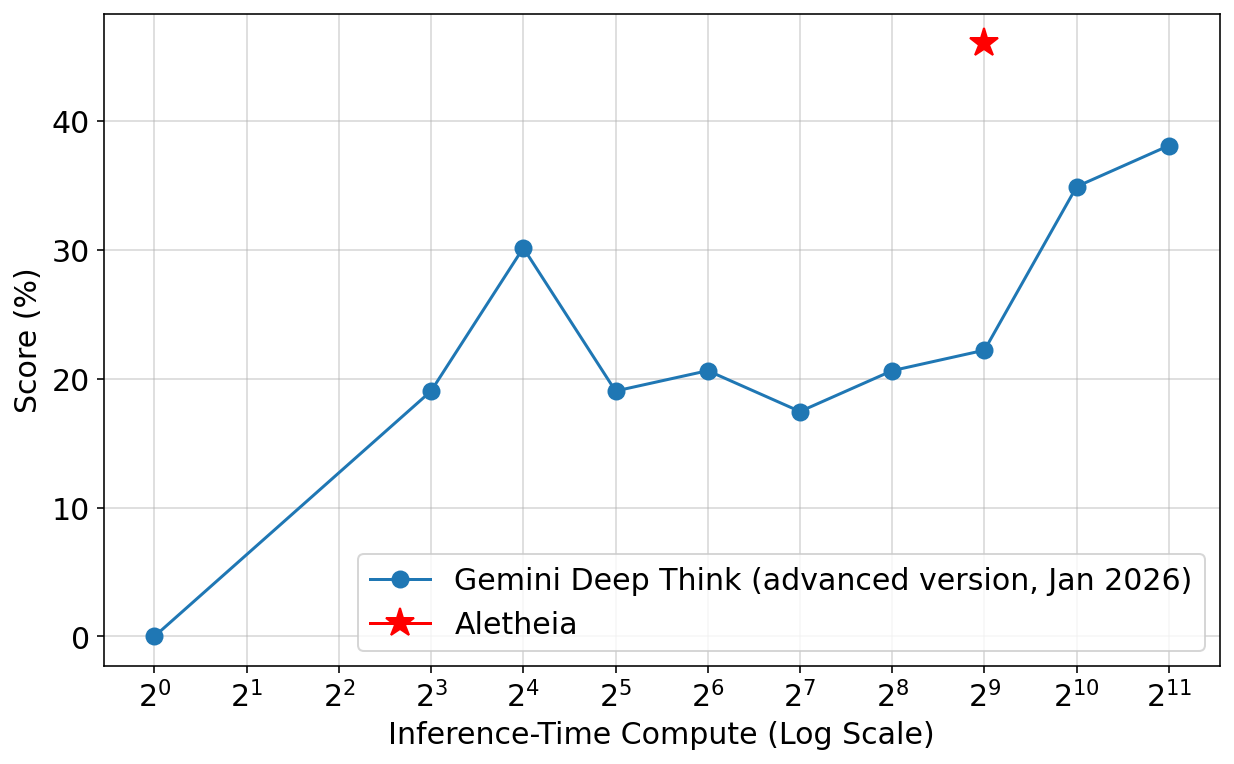
The image displays a line chart comparing the performance (Score %) of two AI models—"Gemini Deep Think" and "Aletheia"—as a function of increasing inference-time compute. The x-axis uses a logarithmic scale (base 2), while the y-axis is linear. The chart suggests a relationship between computational resources allocated during inference and model performance on a specific task or benchmark.
### Components/Axes
* **Chart Type:** Line chart with a logarithmic x-axis.
* **X-Axis:**
* **Label:** "Inference-Time Compute (Log Scale)"
* **Scale:** Logarithmic, base 2.
* **Markers/Ticks:** 2⁰, 2¹, 2², 2³, 2⁴, 2⁵, 2⁶, 2⁷, 2⁸, 2⁹, 2¹⁰, 2¹¹.
* **Y-Axis:**
* **Label:** "Score (%)"
* **Scale:** Linear.
* **Range:** 0 to approximately 45.
* **Major Ticks:** 0, 10, 20, 30, 40.
* **Legend:** Located in the bottom-right quadrant of the chart area.
* **Entry 1:** A blue line with circular markers, labeled "Gemini Deep Think (advanced version, Jan 2026)".
* **Entry 2:** A red star symbol, labeled "Aletheia".
* **Grid:** A light gray grid is present, aligning with the major ticks on both axes.
### Detailed Analysis
**Data Series: Gemini Deep Think (Blue Line with Circles)**
* **Trend:** The line shows an overall upward trend with significant fluctuations. It rises sharply initially, peaks, dips, and then resumes a strong upward climb at higher compute levels.
* **Data Points (Approximate):**
* At x = 2⁰: y ≈ 0%
* At x = 2³: y ≈ 19%
* At x = 2⁴: y ≈ 30% (Local Peak)
* At x = 2⁵: y ≈ 19% (Dip)
* At x = 2⁶: y ≈ 20.5%
* At x = 2⁷: y ≈ 17.5% (Lowest point after initial rise)
* At x = 2⁸: y ≈ 20.5%
* At x = 2⁹: y ≈ 22%
* At x = 2¹⁰: y ≈ 35%
* At x = 2¹¹: y ≈ 38% (Highest point for this series)
**Data Series: Aletheia (Red Star)**
* **Trend:** This is a single data point, not a continuous line. It represents a performance score at a specific compute level.
* **Data Point (Approximate):**
* At x = 2⁹: y ≈ 46% (Positioned significantly above the Gemini line at the same x-value).
### Key Observations
1. **Non-Linear Scaling:** Performance for Gemini Deep Think does not scale linearly with log-compute. There is a notable peak at 2⁴, followed by a regression, before a strong positive trend resumes after 2⁷.
2. **Performance Disparity at 2⁹:** At the compute level of 2⁹, the Aletheia model (red star, ~46%) dramatically outperforms the Gemini Deep Think model (blue circle, ~22%). The vertical gap is approximately 24 percentage points.
3. **Late-Stage Acceleration:** The Gemini model shows its most significant performance gains in the highest compute brackets (from 2⁹ to 2¹¹), jumping from ~22% to ~38%.
4. **Initial Volatility:** The performance between 2⁴ and 2⁸ is volatile, suggesting a region where increased compute does not reliably translate to better scores for this model version.
### Interpretation
This chart illustrates a comparative analysis of model efficiency and scaling laws. The data suggests that:
* **Model Architecture Matters:** Aletheia achieves a very high score (~46%) at a moderate compute level (2⁹), implying it may have a more efficient architecture or training paradigm for this specific task compared to the Gemini Deep Think version tested.
* **Scaling is Not Guaranteed:** The dip in Gemini's performance between 2⁴ and 2⁷ indicates that simply increasing inference-time compute can sometimes lead to worse outcomes, possibly due to overfitting to a certain compute regime or instability in the model's reasoning process at those scales.
* **High-Compute Potential:** The steep upward trajectory for Gemini from 2⁹ to 2¹¹ shows that substantial performance headroom exists at very high compute levels, though this comes at a significant computational cost.
* **Benchmark Context:** The "Score (%)" likely represents accuracy on a specific benchmark. The chart argues that for this benchmark, Aletheia is currently the more compute-efficient solution at the 2⁹ level, while Gemini Deep Think may have a higher ceiling if given orders of magnitude more compute (2¹¹). The "Jan 2026" label on the Gemini series hints at this being a snapshot in time, with model capabilities evolving rapidly.