## Line Graph: Performance vs. Compute (Log Scale)
### Overview
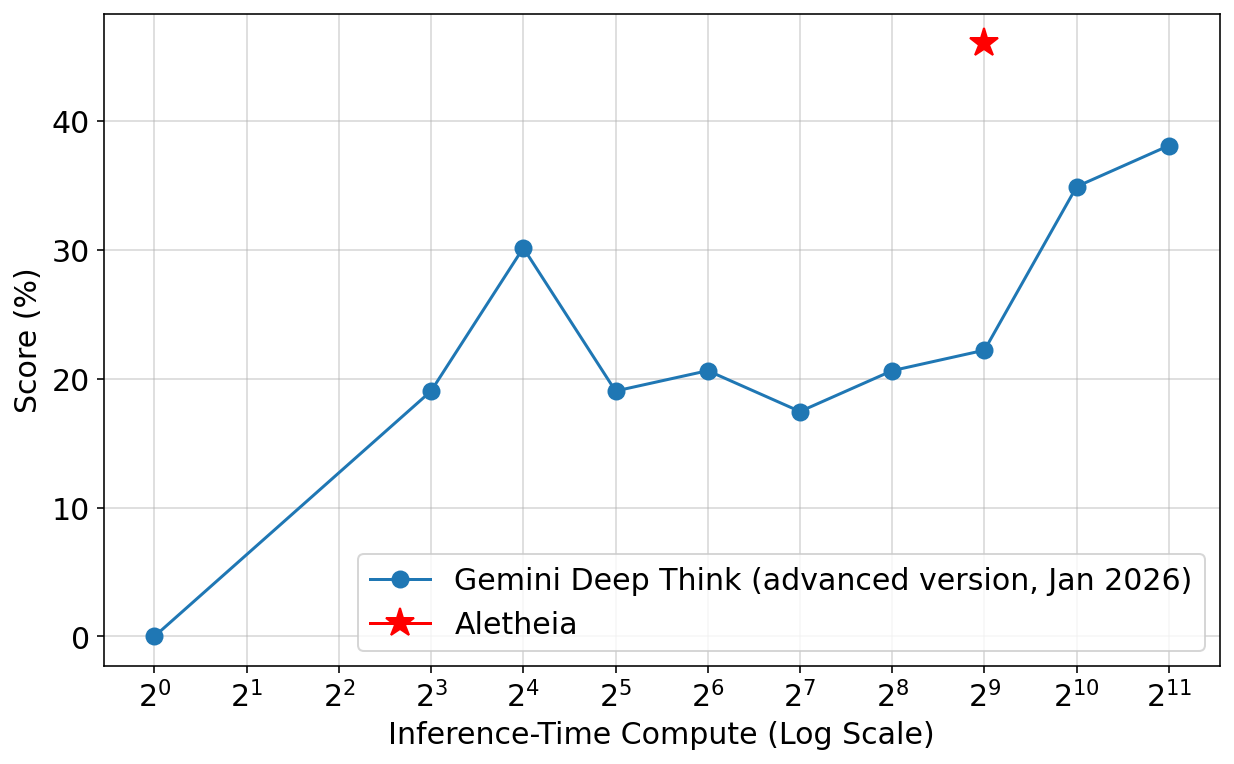
The image depicts a line graph comparing the performance (score %) of two systems—**Gemini Deep Think (advanced version, Jan 2026)** and **Aletheia**—across varying levels of inference-time compute (measured on a logarithmic scale). The x-axis represents compute in powers of 2 (2⁰ to 2¹¹), while the y-axis shows performance scores as percentages (0–40%). A red star marks a notable outlier for Aletheia.
---
### Components/Axes
- **X-Axis (Inference-Time Compute)**: Logarithmic scale from 2⁰ (1) to 2¹¹ (2048). Ticks labeled as 2⁰, 2¹, ..., 2¹¹.
- **Y-Axis (Score %)**: Linear scale from 0% to 40%, with increments of 10%.
- **Legend**:
- **Blue line**: Gemini Deep Think (advanced version, Jan 2026).
- **Red star**: Aletheia.
- **Data Points**:
- Blue line has 10 marked points at 2⁰, 2³, 2⁴, 2⁵, 2⁶, 2⁷, 2⁸, 2⁹, 2¹⁰, and 2¹¹.
- Red star is placed at 2⁹ (512 compute units).
---
### Detailed Analysis
#### Gemini Deep Think (Blue Line)
- **Trend**: The blue line shows a general upward trend with fluctuations.
- **Key Data Points**:
- 2⁰ (1 compute unit): 0% score.
- 2³ (8 compute units): ~19% score.
- 2⁴ (16 compute units): ~30% score.
- 2⁵ (32 compute units): ~19% score.
- 2⁶ (64 compute units): ~20.5% score.
- 2⁷ (128 compute units): ~17.5% score.
- 2⁸ (256 compute units): ~20.5% score.
- 2⁹ (512 compute units): ~22% score.
- 2¹⁰ (1024 compute units): ~34.5% score.
- 2¹¹ (2048 compute units): ~38% score.
- **Pattern**: Performance increases with compute, but there are dips (e.g., 2⁵ and 2⁷). The steepest rise occurs between 2⁹ and 2¹¹.
#### Aletheia (Red Star)
- **Position**: A single red star is placed at 2⁹ (512 compute units) with a score of ~45%, significantly higher than Gemini’s ~22% at the same compute level.
---
### Key Observations
1. **Gemini’s Performance**:
- Scores improve with increased compute, but the relationship is non-linear (e.g., dips at 2⁵ and 2⁷).
- The largest performance jump occurs between 2⁹ and 2¹¹ (from 22% to 38%).
2. **Aletheia’s Outlier**:
- At 2⁹ (512 compute units), Aletheia achieves a score of ~45%, far exceeding Gemini’s ~22% at the same compute level.
- This suggests Aletheia may be more efficient or optimized for this specific task.
---
### Interpretation
- **Gemini’s Scalability**: The data indicates that Gemini’s performance improves with compute, but the relationship is not strictly linear. The dips suggest potential inefficiencies or bottlenecks at certain compute levels.
- **Aletheia’s Advantage**: The red star at 2⁹ highlights a significant performance gap. This could imply that Aletheia is either more optimized for the task, uses compute more effectively, or has a different architectural design.
- **Log Scale Implications**: The logarithmic x-axis emphasizes the exponential growth of compute, making the performance differences at higher compute levels (e.g., 2¹⁰ and 2¹¹) more pronounced.
---
### Final Notes
- **Data Accuracy**: All values are approximate, as the graph lacks gridlines for precise extraction. The red star’s position at 2⁹ is explicitly marked, while Gemini’s scores are inferred from the line’s trajectory.
- **Contextual Relevance**: The graph compares two systems under the same compute constraints, suggesting a focus on efficiency or optimization trade-offs.