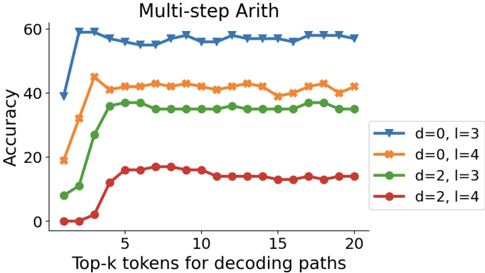
## Line Chart: Multi-step Arith
### Overview
The image is a line chart titled "Multi-step Arith" that plots the accuracy of a model against the top-k tokens for decoding paths. There are four data series, each representing a different configuration of parameters 'd' and 'l'. The x-axis represents the top-k tokens for decoding paths, ranging from 1 to 20. The y-axis represents the accuracy, ranging from 0 to 60.
### Components/Axes
* **Title:** Multi-step Arith
* **X-axis:** Top-k tokens for decoding paths
* Scale: 1 to 20
* **Y-axis:** Accuracy
* Scale: 0 to 60
* **Legend:** Located on the right side of the chart.
* Blue line with triangle markers: d=0, l=3
* Orange line with cross markers: d=0, l=4
* Green line with circle markers: d=2, l=3
* Red line with circle markers: d=2, l=4
### Detailed Analysis
* **Blue line (d=0, l=3):** This line shows a steep initial increase in accuracy, peaking at approximately 60 around x=2, and then fluctuates slightly between 56 and 60 for the remainder of the x-axis.
* (1, 40), (2, 60), (5, 56), (10, 58), (15, 59), (20, 58)
* **Orange line (d=0, l=4):** This line also shows an initial increase, but not as steep as the blue line. It plateaus around 42-44 after x=5.
* (1, 20), (2, 35), (5, 43), (10, 42), (15, 40), (20, 42)
* **Green line (d=2, l=3):** This line starts low and increases steadily until about x=5, where it plateaus around 35-38.
* (1, 10), (2, 20), (5, 37), (10, 36), (15, 38), (20, 35)
* **Red line (d=2, l=4):** This line starts near 0 and increases until about x=7, where it plateaus around 14-16.
* (1, 0), (2, 2), (5, 15), (10, 14), (15, 16), (20, 14)
### Key Observations
* The configuration d=0, l=3 (blue line) consistently achieves the highest accuracy across all top-k token values.
* The accuracy for d=0, l=3 plateaus very quickly, suggesting that increasing the number of top-k tokens beyond a certain point does not significantly improve performance.
* The configurations with d=2 (green and red lines) have lower accuracy compared to those with d=0 (blue and orange lines).
* The accuracy for d=2, l=4 (red line) is the lowest among all configurations.
### Interpretation
The chart suggests that the parameters 'd' and 'l' significantly impact the accuracy of the model in the multi-step arithmetic task. Specifically, setting d=0 and l=3 yields the best performance. The relatively quick plateauing of the accuracy curves indicates that there is a diminishing return in increasing the number of top-k tokens for decoding paths. The lower accuracy of configurations with d=2 suggests that this parameter setting is less effective for this task. The data demonstrates the importance of hyperparameter tuning to optimize model performance.