## Line Chart: Multi-step Arith
### Overview
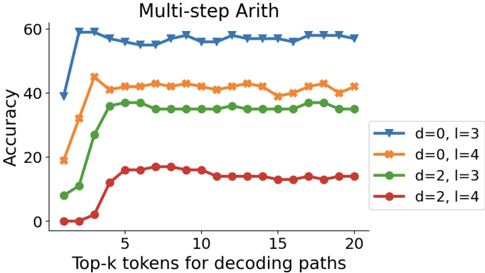
The image presents a line chart illustrating the relationship between "Top-k tokens for decoding paths" and "Accuracy" for different configurations of parameters 'd' and 'l'. The chart appears to evaluate the performance of a multi-step arithmetic model.
### Components/Axes
* **Title:** "Multi-step Arith" (centered at the top)
* **X-axis:** "Top-k tokens for decoding paths" (ranging from approximately 0 to 20, with markers at 0, 5, 10, 15, and 20)
* **Y-axis:** "Accuracy" (ranging from approximately 0 to 60, with markers at 0, 20, 40, and 60)
* **Legend:** Located in the top-right corner, containing the following entries:
* Blue Line: "d=0, l=3"
* Orange Line: "d=0, l=4"
* Green Line: "d=2, l=3"
* Red Line: "d=2, l=4"
### Detailed Analysis
The chart displays four distinct lines, each representing a different combination of 'd' and 'l' values.
* **Blue Line (d=0, l=3):** This line shows a rapid increase in accuracy from approximately 0 to around 58-60% between x-values of 0 and 3. After reaching this peak, the accuracy fluctuates between approximately 52% and 58% as the x-value increases from 3 to 20.
* (0, ~0%)
* (3, ~58%)
* (5, ~55%)
* (10, ~54%)
* (15, ~56%)
* (20, ~55%)
* **Orange Line (d=0, l=4):** This line exhibits a similar initial increase in accuracy, but reaches a lower peak of around 42-45% between x-values of 0 and 3. The accuracy then plateaus and fluctuates between approximately 38% and 42% as the x-value increases from 3 to 20.
* (0, ~0%)
* (3, ~43%)
* (5, ~40%)
* (10, ~40%)
* (15, ~41%)
* (20, ~40%)
* **Green Line (d=2, l=3):** This line shows a moderate increase in accuracy, reaching a peak of around 32-35% between x-values of 0 and 3. The accuracy remains relatively stable, fluctuating between approximately 30% and 35% as the x-value increases from 3 to 20.
* (0, ~0%)
* (3, ~33%)
* (5, ~32%)
* (10, ~32%)
* (15, ~33%)
* (20, ~32%)
* **Red Line (d=2, l=4):** This line demonstrates the slowest increase in accuracy, reaching a peak of around 16-18% between x-values of 0 and 3. The accuracy then declines slightly and remains relatively stable, fluctuating between approximately 12% and 18% as the x-value increases from 3 to 20.
* (0, ~0%)
* (3, ~16%)
* (5, ~14%)
* (10, ~14%)
* (15, ~15%)
* (20, ~14%)
### Key Observations
* The configuration "d=0, l=3" consistently achieves the highest accuracy across all values of "Top-k tokens for decoding paths".
* Increasing the value of 'l' from 3 to 4 appears to decrease the overall accuracy for both d=0 and d=2.
* Increasing 'd' from 0 to 2 also appears to decrease the overall accuracy.
* The accuracy improvements are most significant at lower values of "Top-k tokens for decoding paths" (between 0 and 5). Beyond this point, the gains diminish.
### Interpretation
The chart suggests that the model's performance in multi-step arithmetic is sensitive to the parameters 'd' and 'l'. The optimal configuration appears to be d=0 and l=3, indicating that a smaller number of decoding paths (l=3) and no depth (d=0) yields the best results. The diminishing returns observed at higher values of "Top-k tokens for decoding paths" suggest that there is a point of saturation where adding more decoding paths does not significantly improve accuracy. The negative correlation between 'd' and 'l' and accuracy could indicate that these parameters introduce complexity or noise that hinders the model's ability to solve multi-step arithmetic problems. The chart provides valuable insights into the parameter tuning process for this model, highlighting the importance of finding the right balance between exploration (k) and model complexity (d, l).