## Line Chart: Multi-step Arith Accuracy vs. Top-k Tokens
### Overview
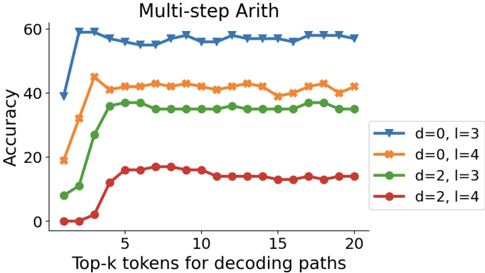
The image is a line chart titled "Multi-step Arith" showing accuracy percentages against the number of top-k tokens used for decoding paths. The chart compares four different configurations, each represented by a distinct line with unique colors and markers. The y-axis represents accuracy (0-60%), and the x-axis represents the number of top-k tokens (0-20).
### Components/Axes
- **Title**: "Multi-step Arith" (top center)
- **Y-axis**: Labeled "Accuracy" with tick marks at 0, 20, 40, 60.
- **X-axis**: Labeled "Top-k tokens for decoding paths" with tick marks at 0, 5, 10, 15, 20.
- **Legend**: Located in the bottom-right corner, containing four entries:
1. Blue line with downward triangle markers: "d=0, l=3"
2. Orange line with cross markers: "d=0, l=4"
3. Green line with circle markers: "d=2, l=3"
4. Red line with circle markers: "d=2, l=4"
### Detailed Analysis
**Data Series Trends and Approximate Values:**
1. **Blue Line (d=0, l=3)**:
- **Trend**: Sharp initial increase, then stabilizes at high accuracy.
- **Key Points**:
- At x=0: Accuracy ≈ 40%
- At x=1: Accuracy jumps to ≈ 58%
- From x=2 to x=20: Accuracy fluctuates slightly between ≈ 55% and 60%, ending near 58% at x=20.
2. **Orange Line (d=0, l=4)**:
- **Trend**: Rapid rise to a peak, then plateaus with minor fluctuations.
- **Key Points**:
- At x=0: Accuracy ≈ 20%
- At x=2: Peaks at ≈ 45%
- From x=5 to x=20: Accuracy stabilizes around 40-42%, ending near 42% at x=20.
3. **Green Line (d=2, l=3)**:
- **Trend**: Steady increase followed by a plateau.
- **Key Points**:
- At x=0: Accuracy ≈ 10%
- At x=5: Reaches ≈ 35%
- From x=5 to x=20: Accuracy remains relatively stable between 30-35%, ending near 35% at x=20.
4. **Red Line (d=2, l=4)**:
- **Trend**: Gradual increase, then stabilizes at lower accuracy.
- **Key Points**:
- At x=0: Accuracy ≈ 0%
- At x=5: Rises to ≈ 15%
- From x=5 to x=20: Accuracy fluctuates slightly around 15%, ending near 15% at x=20.
### Key Observations
- **Performance Hierarchy**: The configuration "d=0, l=3" (blue) consistently achieves the highest accuracy, followed by "d=0, l=4" (orange), then "d=2, l=3" (green), with "d=2, l=4" (red) performing the worst.
- **Impact of Parameters**: Lower "d" values (d=0) yield significantly higher accuracy than higher "d" values (d=2). For a given "d", lower "l" values (l=3) outperform higher "l" values (l=4).
- **Saturation Point**: All lines show diminishing returns after approximately x=5 top-k tokens, with minimal accuracy gains beyond that point.
- **Initial Sensitivity**: The blue line shows extreme sensitivity at x=0 to x=1, jumping from 40% to nearly 60% accuracy with just one additional token.
### Interpretation
This chart likely evaluates the performance of a language model or decoding algorithm on multi-step arithmetic tasks. The parameters "d" and "l" probably represent model depth or decoding constraints (e.g., "d" could be the number of decoding layers, and "l" the length of reasoning steps). The data suggests that:
1. **Simpler Configurations Excel**: Models with lower depth (d=0) and shorter reasoning steps (l=3) perform best, indicating that added complexity (higher d or l) may hinder performance on this specific task.
2. **Token Efficiency**: Accuracy plateaus after using about 5 top-k tokens, implying that beyond this point, additional tokens provide negligible benefit and may increase computational cost without improvement.
3. **Task Difficulty**: The low accuracy of the red line (d=2, l=4) suggests that combining higher depth with longer reasoning steps makes the task significantly harder, possibly due to error propagation or increased complexity in the decoding path.
The chart effectively demonstrates that for multi-step arithmetic, optimizing for lower complexity in both model depth and reasoning steps leads to better and more efficient performance.