## Line Chart: Multi-step Arith Accuracy vs. Top-k Tokens
### Overview
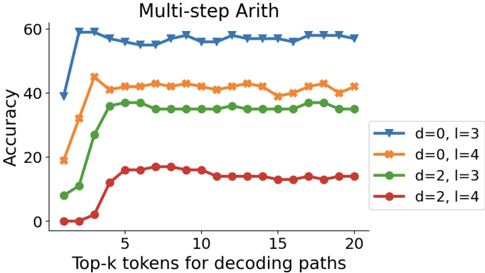
The chart compares the accuracy of different configurations in a multi-step arithmetic task across varying numbers of top-k tokens used for decoding paths. Four configurations are tested, differentiated by parameters `d` (distance) and `l` (layers). Accuracy is measured on a scale from 0 to 60, with top-k tokens ranging from 0 to 20.
### Components/Axes
- **X-axis**: "Top-k tokens for decoding paths" (0–20, increments of 5).
- **Y-axis**: "Accuracy" (0–60, increments of 20).
- **Legend**: Located in the top-right corner, mapping colors/markers to configurations:
- **Blue stars**: `d=0, l=3`
- **Orange circles**: `d=0, l=4`
- **Green diamonds**: `d=2, l=3`
- **Red triangles**: `d=2, l=4`
### Detailed Analysis
1. **Blue line (`d=0, l=3`)**:
- Starts at ~60 accuracy at 0 tokens, remains flat with minor fluctuations (~58–60) across all token counts.
- **Trend**: Stable high performance, unaffected by token count.
2. **Orange line (`d=0, l=4`)**:
- Begins at ~20 accuracy at 0 tokens, rises sharply to ~40 by 5 tokens, then plateaus (~38–42) with slight oscillations.
- **Trend**: Significant improvement with early token inclusion, stabilizes afterward.
3. **Green line (`d=2, l=3`)**:
- Starts at ~10 accuracy at 0 tokens, increases to ~35 by 5 tokens, then stabilizes (~33–37) with minor dips.
- **Trend**: Moderate improvement, slower than orange line.
4. **Red line (`d=2, l=4`)**:
- Begins at ~0 accuracy at 0 tokens, rises to ~15 by 5 tokens, then plateaus (~12–16) with minor fluctuations.
- **Trend**: Limited improvement, lowest overall performance.
### Key Observations
- **Highest accuracy**: `d=0, l=3` (blue) consistently outperforms all configurations.
- **Impact of `d`**: Configurations with `d=0` (blue/orange) achieve higher accuracy than those with `d=2` (green/red).
- **Impact of `l`**: Increasing `l` from 3 to 4 improves performance for `d=0` (orange > blue) but has diminishing returns for `d=2` (red < green).
- **Token sensitivity**: All configurations show improved accuracy with early token inclusion (0–5 tokens), but gains plateau beyond 5 tokens.
### Interpretation
The data suggests that **lower `d` values** (distance) and **higher `l` values** (layers) correlate with better performance in multi-step arithmetic tasks. The `d=0, l=3` configuration achieves near-optimal accuracy (~60) regardless of token count, indicating robustness. The `d=0, l=4` setup shows strong initial gains but plateaus below the blue line, suggesting diminishing returns for additional layers when `d=0`. Conversely, `d=2` configurations underperform, with `l=4` failing to compensate for the higher distance. This implies that **distance (`d`)** is a more critical factor than layer count (`l`) in this context. The red line’s minimal improvement highlights potential limitations in configurations with higher `d`, even with increased `l`. The trends emphasize the importance of balancing `d` and `l` for optimal model performance in arithmetic tasks.