## Bar Chart: Performance Metrics Across Categories
### Overview
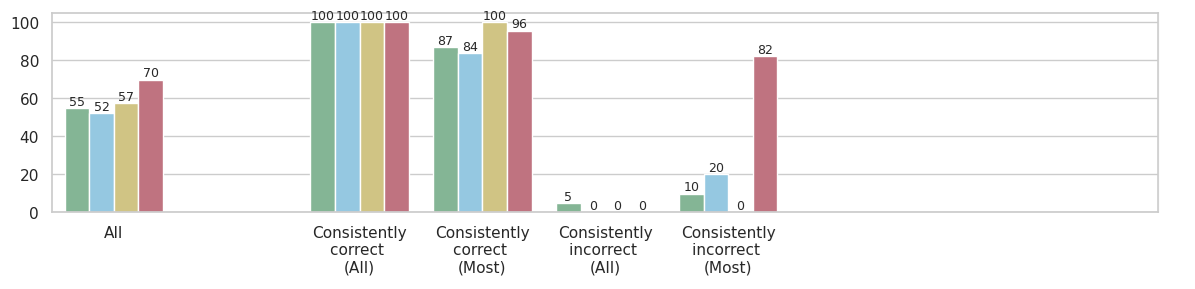
The chart displays performance metrics across five categories: "All," "Consistently correct (All)," "Consistently correct (Most)," "Consistently incorrect (All)," and "Consistently incorrect (Most)." Each category has four bars representing different groups: "All," "Consistently correct (All)," "Consistently correct (Most)," and "Consistently incorrect (Most)." The y-axis ranges from 0 to 100, with values labeled at intervals of 20.
### Components/Axes
- **X-axis (Categories)**:
- "All"
- "Consistently correct (All)"
- "Consistently correct (Most)"
- "Consistently incorrect (All)"
- "Consistently incorrect (Most)"
- **Y-axis (Values)**: 0 to 100, with increments of 20.
- **Legend**:
- **Green**: "All"
- **Blue**: "Consistently correct (All)"
- **Yellow**: "Consistently correct (Most)"
- **Red**: "Consistently incorrect (Most)"
### Detailed Analysis
- **"All" Category**:
- Green ("All"): 55
- Blue ("Consistently correct (All)"): 52
- Yellow ("Consistently correct (Most)"): 57
- Red ("Consistently incorrect (Most)"): 70
- **"Consistently correct (All)" Category**:
- All bars (green, blue, yellow, red): 100
- **"Consistently correct (Most)" Category**:
- Green ("All"): 87
- Blue ("Consistently correct (All)"): 84
- Yellow ("Consistently correct (Most)"): 100
- Red ("Consistently incorrect (Most)"): 96
- **"Consistently incorrect (All)" Category**:
- Green ("All"): 5
- Blue ("Consistently correct (All)"): 0
- Yellow ("Consistently correct (Most)"): 0
- Red ("Consistently incorrect (Most)"): 0
- **"Consistently incorrect (Most)" Category**:
- Green ("All"): 10
- Blue ("Consistently correct (All)"): 20
- Yellow ("Consistently correct (Most)"): 0
- Red ("Consistently incorrect (Most)"): 0
### Key Observations
1. **Perfect Performance in "Consistently correct (All)"**: All groups achieve 100% in this category, indicating uniform success when criteria are met for all.
2. **Highest Performance in "Consistently correct (Most)"**: The "Consistently correct (Most)" group (yellow) scores 100%, followed by "Consistently incorrect (Most)" (red) at 96%, "All" (green) at 87%, and "Consistently correct (All)" (blue) at 84%.
3. **Minimal Performance in "Consistently incorrect (All)"**: Only the "All" group (green) has a non-zero value (5), while others are 0.
4. **Moderate Performance in "Consistently incorrect (Most)"**: The "Consistently correct (All)" group (blue) scores 20%, while "All" (green) scores 10%, and others are 0.
### Interpretation
- **Consistency and Performance**: The data suggests that consistency in correctness (e.g., "Consistently correct (All)") correlates with high performance across all groups. However, when criteria are met for "Most" (not all), the "Consistently correct (Most)" group outperforms others, while the "Consistently incorrect (Most)" group shows slightly lower but still notable performance.
- **Resilience in Inconsistency**: The "Consistently correct (All)" group (blue) demonstrates resilience in the "Consistently incorrect (Most)" category, scoring 20% compared to "All" (green) at 10%. This may indicate that this group maintains some level of performance even when criteria are not fully met.
- **Outliers**: The "Consistently incorrect (All)" category is an outlier, with only the "All" group showing minimal performance (5%), while others have 0. This could reflect a scenario where no group meets the criteria for "All" but the "All" group has a baseline value.
### Spatial Grounding and Trend Verification
- **Legend Placement**: The legend is positioned to the right of the chart, with colors clearly mapped to categories.
- **Trend Verification**:
- "Consistently correct (All)": All bars are flat at 100, confirming uniform performance.
- "Consistently correct (Most)": Yellow (100%) > Red (96%) > Green (87%) > Blue (84%), showing a gradual decline.
- "Consistently incorrect (All)": Only green (5%) is non-zero, aligning with the data.
- "Consistently incorrect (Most)": Blue (20%) > Green (10%), with others at 0, matching the chart.
### Final Notes
The chart highlights the relationship between consistency in correctness and performance metrics. The "Consistently correct (Most)" and "Consistently incorrect (Most)" categories show nuanced differences, while the "Consistently correct (All)" category represents a baseline of perfection. The "Consistently incorrect (All)" category is an anomaly, suggesting a unique scenario where only the "All" group has minimal performance.