## Scatter Plot: Principal Component Analysis for Token "wrong"
### Overview
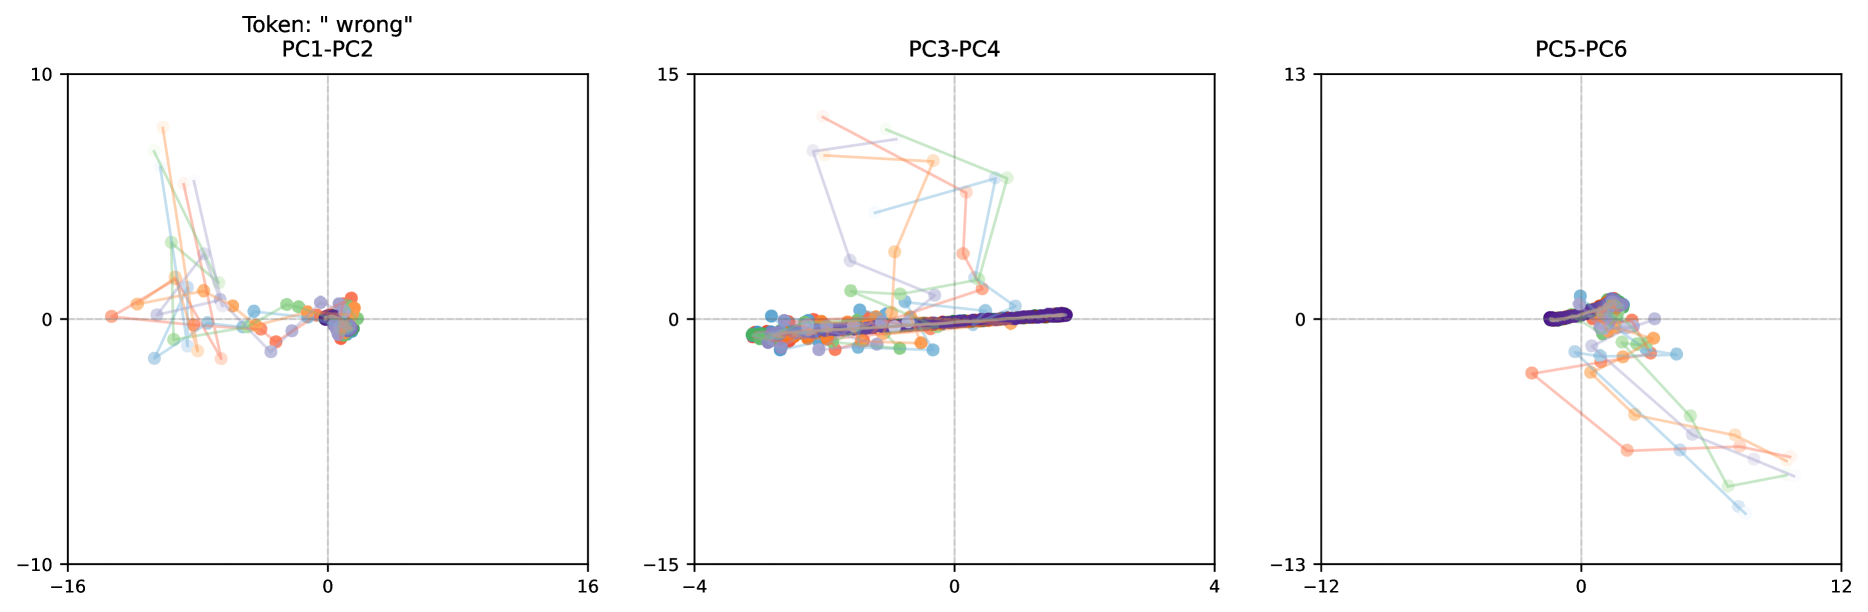
The image presents three scatter plots, each displaying the relationship between two principal components (PCs) for the token "wrong". The plots show the trajectories of data points in the PC space, with each trajectory represented by a different color. The plots are titled PC1-PC2, PC3-PC4, and PC5-PC6, indicating the principal components being visualized in each plot.
### Components/Axes
* **Titles:**
* Top-left plot: "Token: "wrong" PC1-PC2"
* Top-center plot: "PC3-PC4"
* Top-right plot: "PC5-PC6"
* **Axes:** Each plot has x and y axes.
* **Top-left plot (PC1-PC2):**
* X-axis: ranges from -16 to 16
* Y-axis: ranges from -10 to 10
* **Top-center plot (PC3-PC4):**
* X-axis: ranges from -4 to 4
* Y-axis: ranges from -15 to 15
* **Top-right plot (PC5-PC6):**
* X-axis: ranges from -12 to 12
* Y-axis: ranges from -13 to 13
* **Gridlines:** Each plot has light gray gridlines at x=0 and y=0.
* **Data Points:** Each plot contains multiple data points connected by lines, with each line having a distinct color (blue, green, orange, purple, light blue).
### Detailed Analysis
**Top-left plot (PC1-PC2):**
* The data points are clustered near the origin (0,0), with some trajectories extending outwards.
* The trajectories seem to originate from the center and move outwards, then back towards the center.
* The points are scattered, but there is a slight concentration near the origin.
**Top-center plot (PC3-PC4):**
* Most data points are heavily concentrated near the origin (0,0).
* Several trajectories extend outwards from the origin, showing more pronounced movement along both the PC3 and PC4 axes.
* The data points form a dense cluster near the origin, with a few outliers extending away.
**Top-right plot (PC5-PC6):**
* Similar to the other plots, there is a concentration of data points near the origin.
* Trajectories extend outwards from the origin, showing movement along both the PC5 and PC6 axes.
* The data points are more scattered compared to the PC3-PC4 plot.
### Key Observations
* The data points tend to cluster around the origin in all three plots, suggesting that the token "wrong" is primarily represented by the lower-order principal components.
* The trajectories indicate the movement of the data points in the PC space, potentially representing changes or variations in the token's representation.
* The PC3-PC4 plot shows the most concentrated clustering around the origin, while the PC1-PC2 and PC5-PC6 plots show more scattered data points.
### Interpretation
The plots visualize the principal component analysis of the token "wrong". The clustering of data points near the origin suggests that the token's representation is primarily captured by the lower-order principal components (PC1-PC6). The trajectories indicate how the token's representation changes or varies in the PC space. The differences in the distribution of data points across the three plots (PC1-PC2, PC3-PC4, PC5-PC6) suggest that the token's representation is more stable or consistent in the PC3-PC4 space compared to the PC1-PC2 and PC5-PC6 spaces. This could indicate that PC3 and PC4 capture more essential aspects of the token's meaning or usage.