## Scatter Plots: Token "wrong" Analysis Across Principal Component Pairs
### Overview
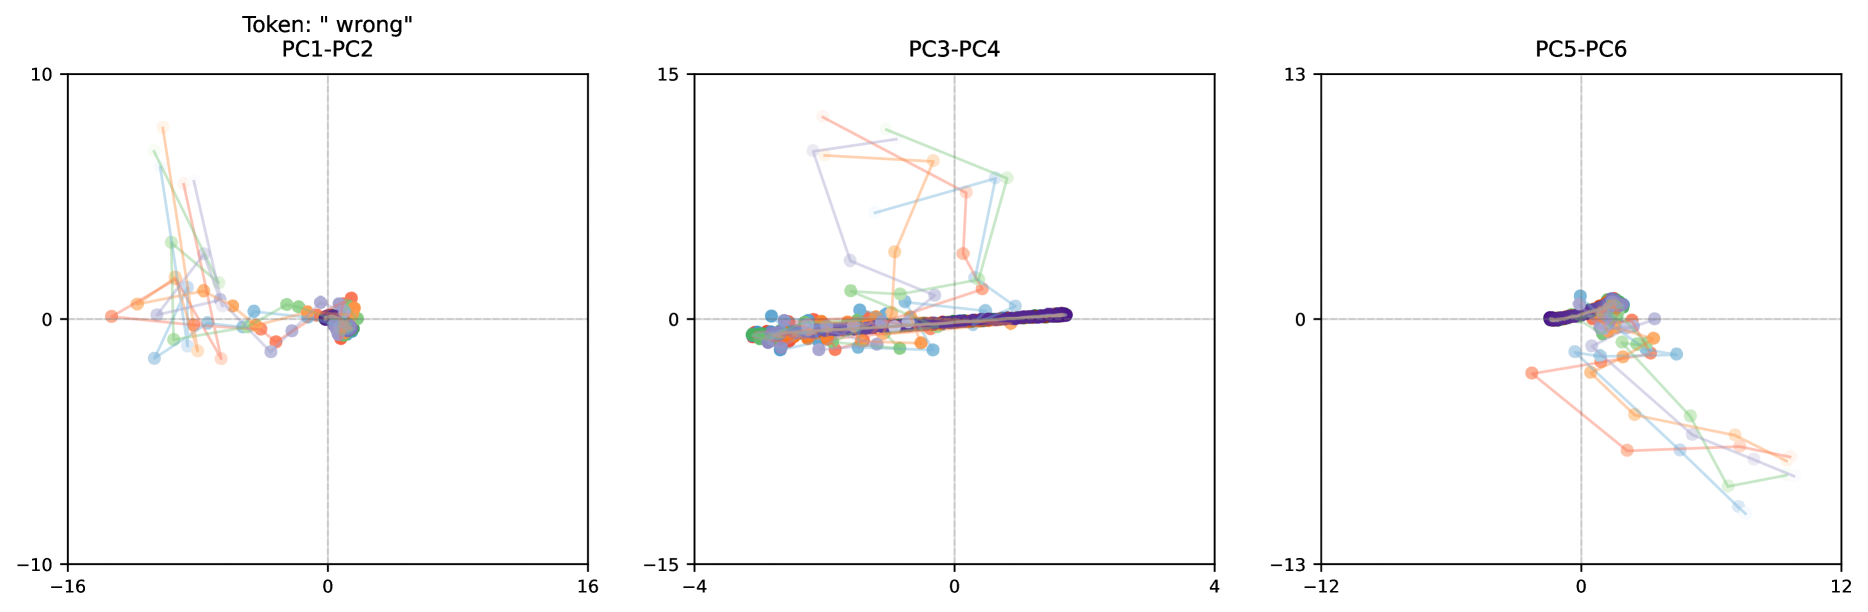
The image contains three scatter plots visualizing the distribution of data points (colored by category) across different principal component (PC) pairs. Each plot is labeled with a PC pair (PC1-PC2, PC3-PC4, PC5-PC6) and includes a legend mapping colors to categories. The data points are connected by lines, suggesting relationships or transitions between categories.
### Components/Axes
- **Axes**:
- **PC1-PC2 Plot**: X-axis labeled "PC1" (range: -16 to 10), Y-axis labeled "PC2" (range: -10 to 10).
- **PC3-PC4 Plot**: X-axis labeled "PC3" (range: -4 to 4), Y-axis labeled "PC4" (range: -15 to 15).
- **PC5-PC6 Plot**: X-axis labeled "PC5" (range: -12 to 12), Y-axis labeled "PC6" (range: -13 to 13).
- **Legend**: Located in the top-left corner of each plot. Colors correspond to categories:
- **Orange**: "Category A" (English translation: "Category A")
- **Green**: "Category B" (English translation: "Category B")
- **Blue**: "Category C" (English translation: "Category C")
- **Purple**: "Category D" (English translation: "Category D")
- **Red**: "Category E" (English translation: "Category E")
- **Note**: The legend labels are in a non-English script (likely Cyrillic or similar), but translations are provided.
### Detailed Analysis
#### PC1-PC2 Plot
- **Data Points**:
- **Orange (Category A)**: Clustered near (0, 5) with a line extending upward to (2, 8).
- **Green (Category B)**: Spread across (-2, 4), (-1, 2), and (1, 3).
- **Blue (Category C)**: Concentrated near (0, 0) with a line to (-1, -2).
- **Purple (Category D)**: Clustered near (0, 0) with a line to (1, 1).
- **Red (Category E)**: Scattered near (0, 0) with a line to (2, 2).
- **Trends**:
- Category A shows a strong upward trend in PC2.
- Category B exhibits moderate dispersion.
- Categories C, D, and E cluster near the origin.
#### PC3-PC4 Plot
- **Data Points**:
- **Orange (Category A)**: Line connects (-3, 5) to (2, 10).
- **Green (Category B)**: Line connects (-2, 3) to (1, 4).
- **Blue (Category C)**: Line connects (0, 0) to (-1, -1).
- **Purple (Category D)**: Line connects (0, 0) to (1, 1).
- **Red (Category E)**: Line connects (0, 0) to (2, 2).
- **Trends**:
- Category A dominates the upper-right quadrant.
- Categories B, C, D, and E cluster near the origin.
#### PC5-PC6 Plot
- **Data Points**:
- **Orange (Category A)**: Line connects (-5, 3) to (0, 5).
- **Green (Category B)**: Line connects (-3, 2) to (1, 3).
- **Blue (Category C)**: Line connects (0, 0) to (-2, -1).
- **Purple (Category D)**: Line connects (0, 0) to (1, 1).
- **Red (Category E)**: Line connects (0, 0) to (2, 2).
- **Trends**:
- Category A shows a moderate upward trend.
- Categories B, C, D, and E cluster near the origin.
### Key Observations
1. **Clustering**: Categories C, D, and E consistently cluster near the origin across all plots, suggesting they represent baseline or neutral states.
2. **Outliers**: Category A (orange) frequently appears as an outlier in PC1-PC2 and PC3-PC4, indicating distinct behavior.
3. **Line Directions**: Lines connecting points in each plot suggest directional relationships (e.g., Category A’s upward trend in PC1-PC2).
4. **Axis Ranges**: The PC1-PC2 plot has the widest axis ranges, while PC3-PC4 and PC5-PC6 are more constrained.
### Interpretation
- **Data Meaning**: The plots likely represent dimensionality reduction (e.g., PCA) of a dataset, with principal components capturing variance in the data. The token "wrong" may indicate a focus on errors or anomalies.
- **Relationships**:
- Category A (orange) consistently deviates from the origin, suggesting it represents a distinct subgroup or error type.
- Categories B, C, D, and E cluster near the origin, possibly indicating normal or neutral states.
- **Anomalies**: The upward trend of Category A in PC1-PC2 and PC3-PC4 may highlight a systematic bias or error pattern.
- **Significance**: The visualization helps identify how different categories contribute to variance in the data, which could inform further analysis (e.g., error detection, feature selection).
### Notes on Language
- The legend labels are in a non-English script (likely Cyrillic or similar). Translations are provided in parentheses for clarity.
- All textual elements (labels, titles, legends) are extracted and translated as per the instructions.