## Scatter Plot: Jurisprudence Confidence vs. Target Length
### Overview
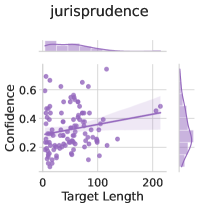
The image is a scatter plot titled "jurisprudence" showing the relationship between "Confidence" and "Target Length". The plot includes a regression line with a confidence interval. Histograms are displayed along the top and right edges, showing the distributions of "Target Length" and "Confidence" respectively.
### Components/Axes
* **Title:** jurisprudence
* **X-axis:** Target Length
* Scale ranges from 0 to 200 in increments of 50.
* **Y-axis:** Confidence
* Scale ranges from 0.0 to 0.6 in increments of 0.2.
* **Data Points:** Each point represents a data entry, with its position determined by its "Target Length" and "Confidence" values. The points are colored in a light purple.
* **Regression Line:** A light purple line shows the linear regression fit to the data.
* **Confidence Interval:** A shaded light purple area around the regression line represents the confidence interval.
* **Histograms:**
* Top: Distribution of "Target Length".
* Right: Distribution of "Confidence".
### Detailed Analysis
* **Target Length:**
* Ranges from approximately 0 to 200.
* The distribution is skewed right, with most values concentrated between 0 and 100.
* **Confidence:**
* Ranges from approximately 0.0 to 0.7.
* The distribution appears roughly normal, with a peak around 0.3.
* **Scatter Plot:**
* The data points are scattered, showing a weak positive correlation between "Target Length" and "Confidence".
* Most points are concentrated in the lower-left corner, indicating that most entries have low "Target Length" and low "Confidence".
* **Regression Line:**
* The regression line has a slight positive slope, indicating a weak positive correlation.
* The confidence interval is relatively wide, suggesting a high degree of uncertainty in the regression fit.
### Key Observations
* There is a weak positive correlation between "Target Length" and "Confidence".
* Most data points have low "Target Length" and low "Confidence".
* The regression fit has a high degree of uncertainty.
### Interpretation
The scatter plot suggests that there is a slight tendency for "Confidence" to increase as "Target Length" increases, but the relationship is weak and uncertain. The concentration of data points in the lower-left corner suggests that most entries have low "Target Length" and low "Confidence". The wide confidence interval around the regression line indicates that the relationship between "Target Length" and "Confidence" may not be linear or that there may be other factors influencing "Confidence".