## Scatter Plot with Marginal Distributions: Jurisprudence Confidence vs. Target Length
### Overview
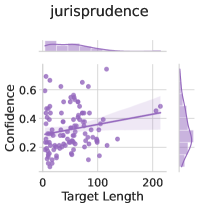
The image is a statistical visualization, specifically a scatter plot with marginal distribution plots (likely kernel density estimates or histograms) on the top and right sides. The chart explores the relationship between "Target Length" and "Confidence" within a context labeled "jurisprudence." The overall aesthetic is minimalist, using a monochromatic purple color scheme against a white background with light gray grid lines.
### Components/Axes
* **Title:** "jurisprudence" is centered at the top of the chart in a sans-serif font.
* **Main Plot (Center):**
* **X-Axis:** Labeled "Target Length." The axis has numerical tick markers at 0, 100, and 200. The scale appears linear.
* **Y-Axis:** Labeled "Confidence." The axis has numerical tick markers at 0.2, 0.4, and 0.6. The scale appears linear.
* **Data Series:** A scatter of purple circular points. A solid purple trend line (likely a linear regression fit) runs through the data, accompanied by a semi-transparent purple shaded region representing the confidence interval for the fit.
* **Marginal Distribution Plots:**
* **Top Marginal Plot:** Positioned directly above the main plot, sharing the "Target Length" x-axis. It displays a density curve (or smoothed histogram) showing the distribution of the "Target Length" variable. The distribution is right-skewed, with a peak between approximately 20 and 80.
* **Right Marginal Plot:** Positioned to the right of the main plot, sharing the "Confidence" y-axis. It displays a density curve showing the distribution of the "Confidence" variable. The distribution is roughly unimodal, centered around 0.3-0.4.
* **Legend/Color Key:** There is no separate legend box. The color purple is used consistently for all data elements (points, trend line, marginal plots), indicating they belong to the same dataset or category.
### Detailed Analysis
* **Data Point Distribution:** The scatter points are most densely clustered in the lower-left quadrant of the plot, where "Target Length" is between 0 and 100 and "Confidence" is between 0.2 and 0.5. As "Target Length" increases beyond 100, the points become more sparse and show greater vertical spread (variance in "Confidence").
* **Trend Line:** The solid purple trend line has a positive slope. It originates at approximately (Target Length ≈ 0, Confidence ≈ 0.25) and terminates at approximately (Target Length ≈ 200, Confidence ≈ 0.5). This indicates a positive correlation between the two variables.
* **Confidence Interval:** The semi-transparent shaded area around the trend line is narrower at lower "Target Length" values (where data is dense) and widens significantly as "Target Length" increases, reflecting greater uncertainty in the trend estimate where data is sparse.
* **Marginal Distributions:**
* The **Target Length** distribution (top) shows that the majority of data points have a length less than 100, with a long tail extending towards 200 and beyond.
* The **Confidence** distribution (right) shows that most confidence values fall between 0.2 and 0.5, with the highest density near 0.35.
### Key Observations
1. **Positive Correlation:** There is a clear, visually apparent positive linear relationship between Target Length and Confidence.
2. **Heteroscedasticity:** The variance (spread) of Confidence values appears to increase as Target Length increases. The relationship is tighter for shorter targets.
3. **Data Sparsity:** The dataset contains far more observations with short target lengths (<100) than with long target lengths (>150).
4. **Outliers:** A few data points exist with relatively high Confidence (>0.6) at moderate Target Lengths (50-100). Conversely, some points with very long Target Lengths (>200) have Confidence values near the lower end of the scale (~0.2).
### Interpretation
The chart suggests that in the domain of "jurisprudence," there is an association where longer "targets" (which could refer to legal documents, case files, or textual arguments) are correlated with higher model or analyst "confidence." However, this relationship is not deterministic.
The **positive trend** implies that length may be a proxy for complexity, thoroughness, or precedent, which in turn allows for greater confidence in assessment or classification. The **increasing variance** (heteroscedasticity) is critical: while confidence tends to be higher on average for long targets, it also becomes much less predictable. A long target could yield very high or surprisingly low confidence.
The **marginal distributions** contextualize this: most analyzed items are of moderate length and yield moderate confidence. The findings are most reliable for targets under 100 units in length. The sparsity of data for very long targets means the trend line's projection in that region is an extrapolation with high uncertainty, as visually confirmed by the wide confidence interval shading.
**In essence, the data demonstrates a general rule that length begets confidence, but with the important caveat that for exceptional cases (very long targets), confidence becomes highly variable and less assured.**