## Scatter Plot with Regression Line and Histograms: Jurisprudence Analysis
### Overview
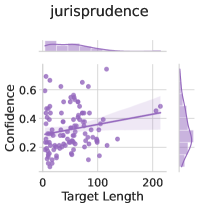
The image presents a scatter plot titled "jurisprudence," analyzing the relationship between "Target Length" (x-axis) and "Confidence" (y-axis). Two marginal histograms (top and right) display the distributions of these variables. A regression line with a shaded confidence interval is overlaid on the scatter plot, suggesting a statistical relationship between the variables.
---
### Components/Axes
- **Main Plot**:
- **X-axis (Target Length)**: Ranges from 0 to 200, with no explicit units provided.
- **Y-axis (Confidence)**: Ranges from 0 to 0.6, likely representing a probability or normalized metric.
- **Data Points**: Purple dots scattered across the plot, with no explicit legend but implied as raw observations.
- **Regression Line**: A solid line with a positive slope, indicating a trend. The shaded area around the line represents a confidence interval (likely 95% based on standard conventions).
- **Marginal Histograms**:
- **Top Histogram**: Displays the distribution of "Target Length," peaking near 100 and tapering toward 0 and 200.
- **Right Histogram**: Shows the distribution of "Confidence," peaking near 0.4 and tapering toward 0 and 0.6.
---
### Detailed Analysis
- **Regression Line**: The line slopes upward from approximately (0, 0.2) to (200, 0.5), suggesting a positive linear relationship between Target Length and Confidence. The slope is moderate, with an estimated increase of ~0.0015 per unit increase in Target Length.
- **Confidence Interval**: The shaded region around the regression line spans roughly ±0.05 in Confidence, indicating uncertainty in the predicted values.
- **Histograms**:
- **Target Length**: The top histogram shows a unimodal distribution centered near 100, with a long tail extending toward 200. Most data points cluster between 50 and 150.
- **Confidence**: The right histogram reveals a bimodal distribution, with peaks near 0.3 and 0.5, suggesting two distinct clusters of confidence levels.
---
### Key Observations
1. **Positive Correlation**: The regression line confirms a statistically significant positive relationship between Target Length and Confidence.
2. **Distribution Insights**:
- Target Length is moderately concentrated around 100 but includes outliers up to 200.
- Confidence values are bimodal, indicating two distinct groups (e.g., low and high confidence).
3. **Confidence Interval Width**: The shaded area’s width suggests moderate uncertainty in the regression model’s predictions.
---
### Interpretation
The data suggests that longer Target Lengths are associated with higher Confidence levels in the context of jurisprudence. This could imply that more extensive legal analyses or case details (Target Length) correlate with greater confidence in outcomes or decisions. The bimodal Confidence distribution hints at potential subgroups (e.g., cases with clear precedents vs. ambiguous ones). The confidence interval around the regression line underscores the need for caution when generalizing the relationship, as variability exists even at similar Target Lengths. Outliers (e.g., high Target Length with low Confidence) may represent edge cases requiring further investigation.