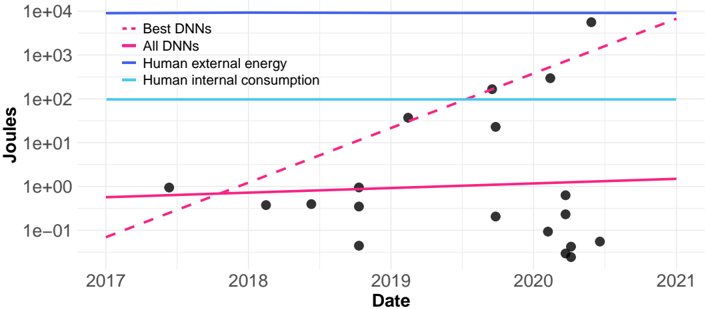
## Chart: Energy Consumption of DNNs vs. Humans
### Overview
The image is a scatter plot showing the energy consumption of Deep Neural Networks (DNNs) over time, compared to human energy consumption. The y-axis represents energy in Joules (logarithmic scale), and the x-axis represents the date from 2017 to 2021. The plot includes data points for individual DNNs, trend lines for "Best DNNs" and "All DNNs", and horizontal lines representing "Human external energy" and "Human internal consumption".
### Components/Axes
* **X-axis:** Date, ranging from 2017 to 2021.
* **Y-axis:** Joules (energy), with a logarithmic scale ranging from 1e-01 to 1e+04.
* **Legend (top-right):**
* Best DNNs (dashed pink line)
* All DNNs (solid pink line)
* Human external energy (solid blue line)
* Human internal consumption (solid light blue line)
### Detailed Analysis
* **Best DNNs (dashed pink line):** This line shows an upward trend, indicating increasing energy consumption over time.
* 2017: Approximately 1e-01 Joules
* 2021: Approximately 1e+03 Joules
* **All DNNs (solid pink line):** This line is relatively flat, suggesting a stable average energy consumption over time.
* 2017: Approximately 0.5 Joules
* 2021: Approximately 1.5 Joules
* **Human external energy (solid blue line):** This line is horizontal, representing a constant energy level.
* Value: Approximately 1e+04 Joules
* **Human internal consumption (solid light blue line):** This line is horizontal, representing a constant energy level.
* Value: Approximately 1e+02 Joules
* **Data Points (black dots):** These points represent individual DNN energy consumption values. They are scattered across the plot, with a higher concentration in 2020.
* 2017: One data point at approximately 1 Joule.
* 2018: Two data points around 0.5 Joules.
* 2019: Two data points, one around 0.5 Joules and one around 20 Joules.
* 2020: Cluster of points ranging from 1e-01 to 1e+04 Joules.
* 2021: One data point around 1e+03 Joules.
### Key Observations
* The energy consumption of the "Best DNNs" is increasing significantly over time.
* The average energy consumption of "All DNNs" remains relatively stable.
* There is a wide range of energy consumption values for individual DNNs, especially in 2020.
* The energy consumption of "Best DNNs" is approaching the level of "Human internal consumption".
* The energy consumption of "All DNNs" is significantly lower than both "Human external energy" and "Human internal consumption".
### Interpretation
The data suggests that while the average energy consumption of DNNs remains relatively stable, the energy consumption of the most advanced DNNs is increasing rapidly. This trend raises concerns about the sustainability of increasingly complex AI models. The scattered data points indicate a wide variation in energy efficiency among different DNN architectures. The comparison to human energy consumption provides a benchmark for evaluating the energy efficiency of AI systems. The increasing energy demands of "Best DNNs" may necessitate the development of more energy-efficient algorithms and hardware to mitigate the environmental impact of AI.