## Scatter Plot with Trend Lines: Energy Consumption of Deep Neural Networks (DNNs) Over Time
### Overview
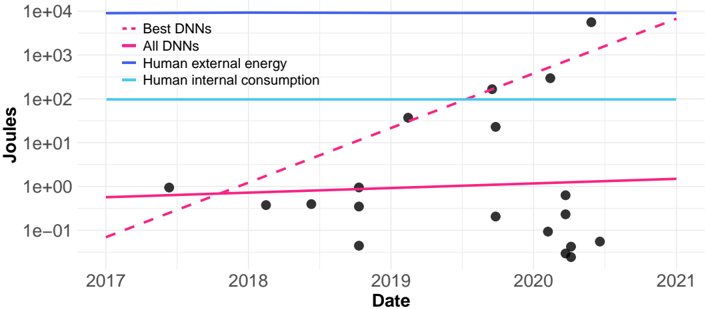
The image is a scatter plot with a logarithmic y-axis, showing the energy consumption (in Joules) of various Deep Neural Network (DNN) models from 2017 to 2021. It includes trend lines for "Best DNNs" and "All DNNs," alongside horizontal reference lines for human energy consumption. The chart illustrates the rapid growth in energy requirements for state-of-the-art AI models compared to human baselines.
### Components/Axes
* **Chart Type:** Scatter plot with overlaid trend lines on a semi-logarithmic scale (log y-axis).
* **X-Axis:**
* **Label:** "Date"
* **Scale:** Linear, from 2017 to 2021.
* **Major Tick Marks:** 2017, 2018, 2019, 2020, 2021.
* **Y-Axis:**
* **Label:** "Joules"
* **Scale:** Logarithmic (base 10).
* **Major Tick Marks (from bottom to top):** `1e-01` (0.1), `1e+00` (1), `1e+01` (10), `1e+02` (100), `1e+03` (1000), `1e+04` (10,000).
* **Legend (Top-Left Corner):**
* `-- Best DNNs` (Dashed pink/magenta line)
* `— All DNNs` (Solid pink/magenta line)
* `— Human external energy` (Solid blue line)
* `— Human internal consumption` (Solid cyan/light blue line)
* **Data Points:** Black circular dots representing individual DNN models.
### Detailed Analysis
* **Data Series & Trends:**
1. **Best DNNs (Dashed Pink Line):** Shows a strong, consistent **exponential upward trend**. It starts below `1e-01` J in early 2017 and rises to approximately `8e+03` J (8,000 J) by late 2020/early 2021. This line crosses the "Human internal consumption" line around mid-2019.
2. **All DNNs (Solid Pink Line):** Shows a very **shallow, near-linear upward trend**. It starts just above `5e-01` J (0.5 J) in 2017 and ends slightly above `1e+00` J (1 J) in 2021. This indicates the average or median energy use for published DNNs has remained relatively stable.
3. **Human external energy (Solid Blue Line):** A **horizontal reference line** at `1e+04` J (10,000 J). This represents a constant benchmark.
4. **Human internal consumption (Solid Cyan Line):** A **horizontal reference line** at `1e+02` J (100 J). This represents a constant benchmark.
* **Data Point Distribution (Black Dots):**
* **2017-2018:** A few points clustered between `1e-01` and `1e+00` J.
* **2019:** Points begin to spread vertically, with one point near `5e+01` J and others below `1e+00` J.
* **2020:** Significant vertical spread. A dense cluster of points exists between `1e-01` and `1e+00` J. Several points are between `1e+01` and `1e+02` J. Two notable high-value points appear: one near `2e+02` J and another near `3e+03` J.
* **Late 2020/Early 2021:** The highest data point is near `8e+03` J, aligning with the "Best DNNs" trend line.
### Key Observations
1. **Diverging Trends:** There is a massive and growing gap between the energy consumption of the most efficient/representative DNNs ("All DNNs" line) and the most powerful, state-of-the-art models ("Best DNNs" line).
2. **Exponential Growth of "Best" Models:** The energy cost of cutting-edge AI models has increased by roughly **five orders of magnitude** (from ~0.1 J to ~10,000 J) in just four years.
3. **Benchmark Crossings:** The "Best DNNs" trend line surpassed the "Human internal consumption" (100 J) benchmark in 2019 and is approaching the "Human external energy" (10,000 J) benchmark by 2021.
4. **Clustering vs. Outliers:** Most published models (the cluster of black dots) remain in the low-energy region (0.1 - 1 J). The high-energy points are outliers that define the "Best DNNs" trend, suggesting a small number of very large models are driving the exponential increase.
### Interpretation
This chart powerfully demonstrates the **"scaling law" phenomenon in modern AI**. While the typical DNN remains relatively energy-efficient, the pursuit of state-of-the-art performance (e.g., for large language models or complex vision systems) has led to an exponential increase in computational—and therefore energy—requirements.
The comparison to human energy benchmarks is striking. It suggests that training or running a single top-tier AI model now requires energy on the order of what a human uses for external activity (like walking) for a day (10,000 J ≈ 2.8 Watt-hours). This trend raises critical questions about the **sustainability and environmental impact of advancing AI capabilities**. The data implies that future breakthroughs in AI efficiency (algorithmic or hardware-based) will be essential to decouple performance gains from exponential energy growth. The chart serves as a quantitative argument for the importance of research into energy-efficient AI.