## Line Chart: Energy Consumption and AI Efficiency Trends (2017-2021)
### Overview
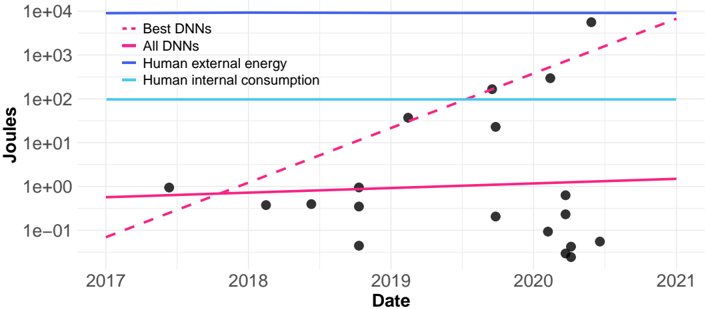
The chart visualizes the growth of AI efficiency (Best DNNs and All DNNs) alongside human energy metrics (external energy and internal consumption) over five years. The y-axis uses a logarithmic scale (Joules), while the x-axis spans 2017–2021. Key trends include exponential growth in AI efficiency and stable human energy consumption.
### Components/Axes
- **X-axis (Date)**: 2017 to 2021 (annual intervals).
- **Y-axis (Joules)**: Logarithmic scale from 1e-1 to 1e4.
- **Legend**: Located in the top-right corner, with four entries:
- **Best DNNs**: Dashed red line.
- **All DNNs**: Solid red line.
- **Human external energy**: Solid blue line.
- **Human internal consumption**: Solid cyan line.
### Detailed Analysis
1. **Best DNNs (Dashed Red Line)**:
- Starts at ~1e0 Joules in 2017.
- Exponential growth to ~1e4 Joules by 2021.
- Crosses the **All DNNs** line (~1e3 Joules in 2020) and surpasses it by 2021.
2. **All DNNs (Solid Red Line)**:
- Begins at ~1e0 Joules in 2017.
- Gradual linear increase to ~1e3 Joules by 2021.
- Data points (black dots) align closely with the line, showing consistent growth.
3. **Human External Energy (Solid Blue Line)**:
- Flat line at ~1e4 Joules throughout 2017–2021.
- No variation observed.
4. **Human Internal Consumption (Solid Cyan Line)**:
- Flat line at ~1e2 Joules throughout 2017–2021.
- Remains significantly lower than external energy.
### Key Observations
- **Best DNNs** exhibit exponential growth, outpacing **All DNNs** by 2020.
- **Human external energy** (1e4 Joules) is 10x higher than **internal consumption** (1e2 Joules), with no change over time.
- **All DNNs** growth is linear, contrasting with the exponential trajectory of **Best DNNs**.
### Interpretation
The chart highlights a divergence between AI efficiency and human energy use:
- **Best DNNs** (dashed red) likely represent optimized AI models, showing rapid efficiency gains (e.g., reduced energy per task). Their exponential growth suggests breakthroughs in AI architecture or training methods.
- **All DNNs** (solid red) reflect broader AI adoption, with slower, linear progress, possibly due to incremental improvements or scaling challenges.
- **Human energy metrics** (blue and cyan lines) remain static, implying either stable energy consumption patterns or normalization of data (e.g., per capita or per task). The 10x gap between external and internal energy use may indicate that external energy (e.g., grid power) dominates human activity, while internal consumption (e.g., metabolic energy) is negligible in this context.
The data underscores AI's transformative potential in energy efficiency, though real-world adoption (All DNNs) lags behind theoretical best-case scenarios (Best DNNs). The flat human energy lines raise questions about whether the chart normalizes energy use or reflects absolute values, which could impact interpretations of sustainability trends.