## Bar Chart: Model Performance on Datasets
### Overview
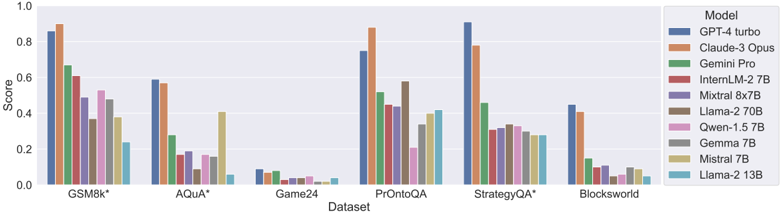
The image is a bar chart comparing the performance of various language models on different datasets. The chart displays the "Score" achieved by each model on each dataset, allowing for a comparison of their effectiveness across different tasks.
### Components/Axes
* **X-axis:** "Dataset" with the following categories: GSM8k*, AQUA*, Game24, PrOntoQA, StrategyQA*, Blocksworld.
* **Y-axis:** "Score" ranging from 0.0 to 1.0, with increments of 0.2.
* **Legend (Top-Right):** Lists the models, each associated with a specific color:
* GPT-4 turbo (Dark Blue)
* Claude-3 Opus (Orange)
* Gemini Pro (Green)
* InternLM-2 7B (Red-Brown)
* Mixtral 8x7B (Purple)
* Llama-2 70B (Brown)
* Qwen-1.5 7B (Pink)
* Gemma 7B (Gray)
* Mistral 7B (Tan)
* Llama-2 13B (Light Blue)
### Detailed Analysis
**Dataset: GSM8k***
* GPT-4 turbo (Dark Blue): Score ~0.86
* Claude-3 Opus (Orange): Score ~0.90
* Gemini Pro (Green): Score ~0.67
* InternLM-2 7B (Red-Brown): Score ~0.52
* Mixtral 8x7B (Purple): Score ~0.48
* Llama-2 70B (Brown): Score ~0.58
* Qwen-1.5 7B (Pink): Score ~0.40
* Gemma 7B (Gray): Score ~0.36
* Mistral 7B (Tan): Score ~0.24
* Llama-2 13B (Light Blue): Score ~0.22
**Dataset: AQUA***
* GPT-4 turbo (Dark Blue): Score ~0.59
* Claude-3 Opus (Orange): Score ~0.57
* Gemini Pro (Green): Score ~0.28
* InternLM-2 7B (Red-Brown): Score ~0.17
* Mixtral 8x7B (Purple): Score ~0.09
* Llama-2 70B (Brown): Score ~0.16
* Qwen-1.5 7B (Pink): Score ~0.16
* Gemma 7B (Gray): Score ~0.14
* Mistral 7B (Tan): Score ~0.06
* Llama-2 13B (Light Blue): Score ~0.05
**Dataset: Game24**
* GPT-4 turbo (Dark Blue): Score ~0.08
* Claude-3 Opus (Orange): Score ~0.07
* Gemini Pro (Green): Score ~0.07
* InternLM-2 7B (Red-Brown): Score ~0.03
* Mixtral 8x7B (Purple): Score ~0.04
* Llama-2 70B (Brown): Score ~0.03
* Qwen-1.5 7B (Pink): Score ~0.03
* Gemma 7B (Gray): Score ~0.02
* Mistral 7B (Tan): Score ~0.04
* Llama-2 13B (Light Blue): Score ~0.01
**Dataset: PrOntoQA**
* GPT-4 turbo (Dark Blue): Score ~0.42
* Claude-3 Opus (Orange): Score ~0.88
* Gemini Pro (Green): Score ~0.43
* InternLM-2 7B (Red-Brown): Score ~0.20
* Mixtral 8x7B (Purple): Score ~0.40
* Llama-2 70B (Brown): Score ~0.34
* Qwen-1.5 7B (Pink): Score ~0.22
* Gemma 7B (Gray): Score ~0.32
* Mistral 7B (Tan): Score ~0.41
* Llama-2 13B (Light Blue): Score ~0.10
**Dataset: StrategyQA***
* GPT-4 turbo (Dark Blue): Score ~0.92
* Claude-3 Opus (Orange): Score ~0.80
* Gemini Pro (Green): Score ~0.42
* InternLM-2 7B (Red-Brown): Score ~0.32
* Mixtral 8x7B (Purple): Score ~0.30
* Llama-2 70B (Brown): Score ~0.33
* Qwen-1.5 7B (Pink): Score ~0.30
* Gemma 7B (Gray): Score ~0.29
* Mistral 7B (Tan): Score ~0.30
* Llama-2 13B (Light Blue): Score ~0.29
**Dataset: Blocksworld**
* GPT-4 turbo (Dark Blue): Score ~0.44
* Claude-3 Opus (Orange): Score ~0.12
* Gemini Pro (Green): Score ~0.21
* InternLM-2 7B (Red-Brown): Score ~0.05
* Mixtral 8x7B (Purple): Score ~0.03
* Llama-2 70B (Brown): Score ~0.08
* Qwen-1.5 7B (Pink): Score ~0.07
* Gemma 7B (Gray): Score ~0.04
* Mistral 7B (Tan): Score ~0.10
* Llama-2 13B (Light Blue): Score ~0.40
### Key Observations
* GPT-4 turbo and Claude-3 Opus generally outperform the other models across most datasets.
* Game24 appears to be a particularly challenging dataset for all models, with scores consistently low.
* The performance of different models varies significantly depending on the dataset.
* The models Llama-2 13B, Mistral 7B, and Gemma 7B generally have lower scores compared to the top performers.
### Interpretation
The bar chart provides a comparative analysis of the performance of different language models on a range of datasets. The data suggests that GPT-4 turbo and Claude-3 Opus are the most effective models overall, achieving higher scores across most tasks. However, the relative performance of the models varies depending on the specific dataset, indicating that some models are better suited for certain types of tasks than others. The low scores on the Game24 dataset suggest that this task is particularly challenging for all the models tested. The chart highlights the importance of selecting the appropriate model for a given task based on its strengths and weaknesses.