\n
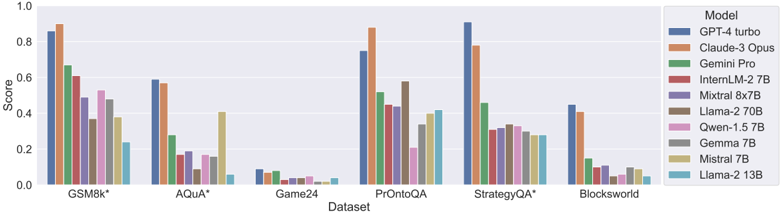
## Bar Chart: Model Performance on Various Datasets
### Overview
The image presents a bar chart comparing the performance scores of several large language models (LLMs) across six different datasets. The y-axis represents the 'Score', ranging from 0.0 to 1.0, while the x-axis lists the datasets: GSM8k*, Aqua*, Game24, PrOntoQA, StrategyQA*, and Blocksworld. Each dataset has multiple bars, each representing the score achieved by a different LLM. A legend on the right identifies each model by color.
### Components/Axes
* **X-axis:** Dataset - GSM8k*, Aqua*, Game24, PrOntoQA, StrategyQA*, Blocksworld.
* **Y-axis:** Score - Scale from 0.0 to 1.0.
* **Legend (Top-Right):**
* GPT-4 turbo (Blue)
* Claude-3 Opus (Orange)
* Gemini Pro (Green)
* InternLM-2 7B (Red)
* Mixtral 8x7B (Purple)
* Llama-2 70B (Brown)
* Qwen-1.5 7B (Pink)
* Gemma 7B (Gray)
* Mistral 7B (Teal)
* Llama-2 13B (Light Blue)
### Detailed Analysis
Here's a breakdown of the scores for each model on each dataset, with approximate values based on visual estimation:
* **GSM8k*:**
* GPT-4 turbo: ~0.94
* Claude-3 Opus: ~0.92
* Gemini Pro: ~0.68
* InternLM-2 7B: ~0.45
* Mixtral 8x7B: ~0.62
* Llama-2 70B: ~0.55
* Qwen-1.5 7B: ~0.40
* Gemma 7B: ~0.30
* Mistral 7B: ~0.25
* Llama-2 13B: ~0.15
* **Aqua*:**
* GPT-4 turbo: ~0.62
* Claude-3 Opus: ~0.58
* Gemini Pro: ~0.55
* InternLM-2 7B: ~0.22
* Mixtral 8x7B: ~0.45
* Llama-2 70B: ~0.35
* Qwen-1.5 7B: ~0.25
* Gemma 7B: ~0.18
* Mistral 7B: ~0.15
* Llama-2 13B: ~0.08
* **Game24:**
* GPT-4 turbo: ~0.95
* Claude-3 Opus: ~0.90
* Gemini Pro: ~0.40
* InternLM-2 7B: ~0.05
* Mixtral 8x7B: ~0.50
* Llama-2 70B: ~0.20
* Qwen-1.5 7B: ~0.05
* Gemma 7B: ~0.02
* Mistral 7B: ~0.03
* Llama-2 13B: ~0.01
* **PrOntoQA:**
* GPT-4 turbo: ~0.92
* Claude-3 Opus: ~0.85
* Gemini Pro: ~0.50
* InternLM-2 7B: ~0.40
* Mixtral 8x7B: ~0.70
* Llama-2 70B: ~0.55
* Qwen-1.5 7B: ~0.45
* Gemma 7B: ~0.35
* Mistral 7B: ~0.30
* Llama-2 13B: ~0.20
* **StrategyQA*:**
* GPT-4 turbo: ~0.95
* Claude-3 Opus: ~0.90
* Gemini Pro: ~0.60
* InternLM-2 7B: ~0.30
* Mixtral 8x7B: ~0.75
* Llama-2 70B: ~0.50
* Qwen-1.5 7B: ~0.35
* Gemma 7B: ~0.25
* Mistral 7B: ~0.20
* Llama-2 13B: ~0.10
* **Blocksworld:**
* GPT-4 turbo: ~0.90
* Claude-3 Opus: ~0.85
* Gemini Pro: ~0.50
* InternLM-2 7B: ~0.10
* Mixtral 8x7B: ~0.40
* Llama-2 70B: ~0.25
* Qwen-1.5 7B: ~0.15
* Gemma 7B: ~0.05
* Mistral 7B: ~0.03
* Llama-2 13B: ~0.01
### Key Observations
* GPT-4 turbo and Claude-3 Opus consistently achieve the highest scores across all datasets.
* Gemini Pro generally performs well, but lags behind GPT-4 turbo and Claude-3 Opus.
* Smaller models (InternLM-2 7B, Gemma 7B, Mistral 7B, Llama-2 13B) exhibit significantly lower scores, particularly on more challenging datasets like Game24 and Blocksworld.
* Mixtral 8x7B and Llama-2 70B show intermediate performance, often outperforming the smaller models but falling short of the top performers.
* The datasets GSM8k* and StrategyQA* show the largest performance differences between models.
### Interpretation
This chart demonstrates a clear hierarchy in the performance of these LLMs across a variety of reasoning and knowledge-based tasks. GPT-4 turbo and Claude-3 Opus represent the state-of-the-art, exhibiting strong capabilities in all tested domains. The performance gap between these models and the others highlights the importance of model size and architecture in achieving high accuracy.
The varying performance across datasets suggests that different models excel at different types of reasoning. For example, the high scores on GSM8k* (mathematical problem solving) and StrategyQA* (multi-hop reasoning) for GPT-4 turbo and Claude-3 Opus indicate their strong capabilities in these areas. The consistently low scores of smaller models suggest they may lack the capacity to effectively handle complex reasoning tasks.
The asterisks (*) after GSM8k and StrategyQA likely indicate that these datasets have specific characteristics or variations that influence the results. Further investigation into these datasets would be needed to understand the nuances of the observed performance differences. The chart provides valuable insights into the strengths and weaknesses of different LLMs, which can inform model selection for specific applications.