## Diagram: Flow Channel with Varying Obstructions
### Overview
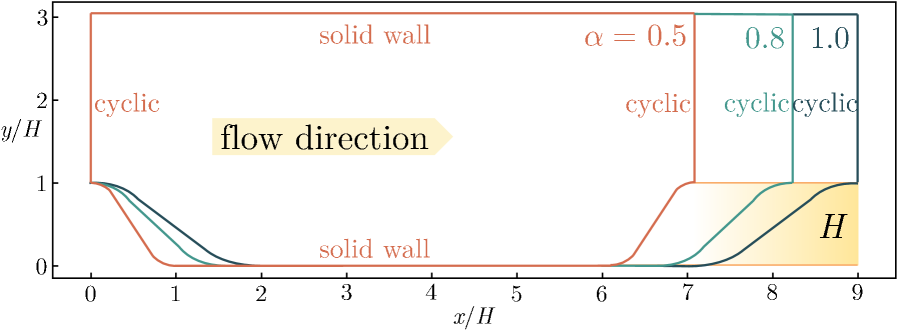
The image depicts a two-dimensional flow channel with obstructions of varying shapes and sizes. The channel is defined by solid walls and cyclic boundaries. The diagram illustrates the impact of different obstruction profiles on the flow.
### Components/Axes
* **X-axis:** x/H, ranging from 0 to 9.
* **Y-axis:** y/H, ranging from 0 to 3.
* **Boundaries:**
* Solid walls (top and bottom)
* Cyclic boundaries (left and right sides)
* **Obstructions:** Three different obstruction profiles are shown, each corresponding to a different value of alpha (α).
* α = 0.5 (brown line)
* α = 0.8 (teal line)
* α = 1.0 (dark teal line)
* **Flow Direction:** Indicated by a yellow arrow pointing from left to right.
* **Region H:** A yellow shaded region near the right side of the channel, labeled "H".
### Detailed Analysis
* **Channel Geometry:** The channel is rectangular, with the x-axis representing the horizontal length and the y-axis representing the vertical height.
* **Boundary Conditions:** The top and bottom boundaries are solid walls, implying no-slip conditions. The left and right boundaries are cyclic, indicating periodic boundary conditions.
* **Obstructions:**
* The obstruction for α = 0.5 (brown) starts at x/H ≈ 0, rises to y/H ≈ 1, remains constant until x/H ≈ 6, then drops back down to y/H ≈ 0.
* The obstruction for α = 0.8 (teal) starts at x/H ≈ 0, rises to y/H ≈ 1, remains constant until x/H ≈ 7, then drops back down to y/H ≈ 0.
* The obstruction for α = 1.0 (dark teal) starts at x/H ≈ 0, rises to y/H ≈ 1, remains constant until x/H ≈ 7.75, then drops back down to y/H ≈ 0.
* **Flow Direction:** The flow is from left to right, as indicated by the arrow. The obstructions will influence the flow field, creating pressure gradients and velocity variations.
* **Region H:** The yellow shaded region labeled "H" likely represents the height of the channel or a characteristic length scale.
### Key Observations
* The obstructions are located on the bottom wall of the channel.
* The parameter α controls the shape and size of the obstruction.
* As α increases, the obstruction becomes taller and extends further into the channel.
* The cyclic boundary conditions suggest that the flow is expected to repeat periodically along the x-axis.
### Interpretation
The diagram illustrates the impact of different obstruction profiles on the flow within a channel. The parameter α is a key design variable that controls the shape and size of the obstruction. By varying α, the flow field can be manipulated to achieve desired performance characteristics. The cyclic boundary conditions imply that this setup is modeling a repeating section of a larger flow domain. The "H" region likely indicates a reference height used for normalization or analysis of the flow behavior. The diagram is likely used to study the effects of different obstruction shapes on flow characteristics such as pressure drop, velocity distribution, and turbulence.