## Diagram: Flow Field with Boundary Conditions and Parameter Zones
### Overview
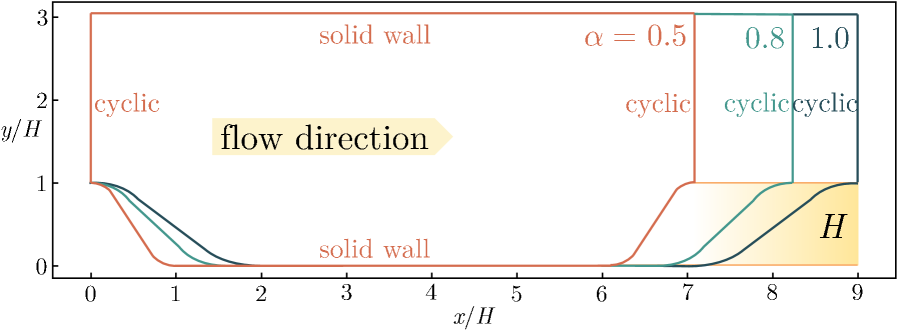
The diagram illustrates a flow field with normalized coordinates (x/H, y/H), where H is a characteristic length scale. It depicts regions with distinct boundary conditions ("solid wall," "cyclic") and parameter zones (α = 0.5, 0.8, 1.0). A highlighted area labeled "H" is marked in the bottom-right corner, and a flow direction arrow indicates the direction of movement.
### Components/Axes
- **Axes**:
- **x/H**: Horizontal axis, ranging from 0 to 9.
- **y/H**: Vertical axis, ranging from 0 to 3.
- **Regions**:
- **Solid wall**: Red-shaded regions on the left (x/H ≈ 0–1) and right (x/H ≈ 8–9).
- **Cyclic**: Teal-shaded region in the middle (x/H ≈ 1–6).
- **Cyclic cyclic**: Dark blue-shaded region on the far right (x/H ≈ 6–8).
- **Parameter Zones**:
- **α = 0.5**: Labeled at x/H ≈ 6.
- **α = 0.8**: Labeled at x/H ≈ 7.
- **α = 1.0**: Labeled at x/H ≈ 8.
- **Flow Direction**: Arrow pointing from left to right (center of the diagram).
- **Highlighted Area**: Yellow-shaded region labeled "H" at the bottom-right (x/H ≈ 8–9, y/H ≈ 0–1).
### Detailed Analysis
- **Boundary Conditions**:
- **Solid wall**: No-slip boundaries at x/H ≈ 0–1 and x/H ≈ 8–9.
- **Cyclic**: Periodic boundary conditions in the central region (x/H ≈ 1–6).
- **Cyclic cyclic**: Overlapping cyclic conditions in the transition zone (x/H ≈ 6–8).
- **Parameter Zones**:
- α increases from 0.5 to 1.0 as x/H increases, suggesting a gradient in a parameter (e.g., porosity, phase fraction, or turbulence intensity).
- **Highlighted Area (H)**:
- Positioned at the bottom-right corner (x/H ≈ 8–9, y/H ≈ 0–1), possibly indicating a region of interest (e.g., a boundary layer, separation zone, or transition area).
### Key Observations
1. **Flow Transition**: The flow moves from a "solid wall" region (no-slip) to a "cyclic" region (periodic), then to a "cyclic cyclic" zone, suggesting a complex interaction between boundary conditions.
2. **Parameter Gradient**: α increases monotonically from 0.5 to 1.0, indicating a systematic change in the parameter across the flow field.
3. **Highlighted Region (H)**: The yellow-shaded area "H" may represent a critical zone where flow behavior changes (e.g., turbulence onset, separation, or boundary layer development).
### Interpretation
This diagram likely represents a computational fluid dynamics (CFD) simulation or experimental setup with varying boundary conditions and material properties. The "solid wall" regions act as fixed boundaries, while the "cyclic" regions imply periodic or repeating flow patterns. The parameter α (e.g., porosity, phase fraction, or turbulence intensity) increases with x/H, suggesting a gradient in the medium or flow conditions. The highlighted "H" area could mark a region where a specific phenomenon occurs, such as flow separation, transition to turbulence, or a boundary layer development. The flow direction arrow confirms the left-to-right movement, aligning with the spatial progression of boundary conditions and parameter changes.
**Note**: The diagram does not include numerical data tables or explicit equations, so interpretations are based on spatial and label-based analysis.