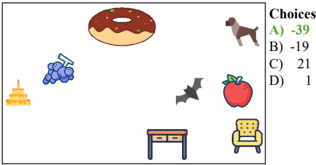
## Diagram: Object-Choice Association Matrix
### Overview
The image depicts a diagrammatic layout of eight distinct objects arranged in a grid-like pattern, each associated with a labeled numerical value under a "Choices" section. The objects include food items, animals, furniture, and abstract symbols. Numerical values are assigned to specific objects via alphanumeric labels (A-D), with some values negative and others positive.
### Components/Axes
- **Objects**:
- Top-left: Chocolate-glazed donut (brown icing, white center hole).
- Top-right: Brown dog (profile view, collar).
- Left-middle: Purple grapes (cluster with green stem).
- Left-bottom: Yellow tiered cake (three layers, lit candle).
- Center-left: Black bat (wing spread).
- Center-right: Red apple (green leaf).
- Bottom-left: Wooden table (two drawers, brown surface).
- Bottom-right: Yellow armchair (polka-dot pattern, four legs).
- **Choices Section**:
- Right-aligned vertical list labeled "Choices" with four options:
- **A) -39**: Associated with the dog (top-right).
- **B) -19**: Associated with the apple (center-right).
- **C) 21**: Associated with the bat (center-left).
- **D) 1**: Associated with the chair (bottom-right).
### Detailed Analysis
- **Object-Choice Mapping**:
- The dog (A) is assigned the most negative value (-39).
- The apple (B) has a moderately negative value (-19).
- The bat (C) has a positive value (21), the highest among all.
- The chair (D) has the smallest positive value (1).
- The remaining objects (donut, grapes, cake, table) lack direct numerical associations.
- **Spatial Distribution**:
- Negative values (-39, -19) are assigned to objects in the top-right and center-right regions.
- Positive values (21, 1) are assigned to objects in the center-left and bottom-right regions.
- Unassociated objects (donut, grapes, cake, table) occupy the left and bottom-left regions.
### Key Observations
1. **Value Extremes**: The dog (A) has the most extreme negative value (-39), while the bat (C) has the highest positive value (21).
2. **Negative Values**: Both negative values (-39, -19) are assigned to consumable items (dog, apple), though the dog is an animal.
3. **Positive Values**: The bat (C) and chair (D) have positive values, but their magnitudes differ significantly (21 vs. 1).
4. **Unassociated Objects**: Four objects (donut, grapes, cake, table) lack numerical labels, suggesting incomplete data or a filtering mechanism.
### Interpretation
The diagram appears to represent a decision-making or prioritization task where objects are scored numerically. The stark contrast between negative and positive values (-39 vs. 21) suggests a binary or polarized evaluation system. However, the absence of context (e.g., criteria for scoring, units, or purpose) limits interpretability. The unassociated objects may indicate excluded categories or incomplete data entry. The spatial arrangement does not follow a clear pattern, implying the values are not derived from positional logic but rather arbitrary or context-dependent assignments.
**Note**: No axis titles, legends, or scales are present, and the diagram lacks explanatory text beyond the "Choices" heading. The numerical values are embedded directly in the choices list, with no visual correlation to the objects’ positions or attributes.