## Box Plot: Score Distribution by Metric
### Overview
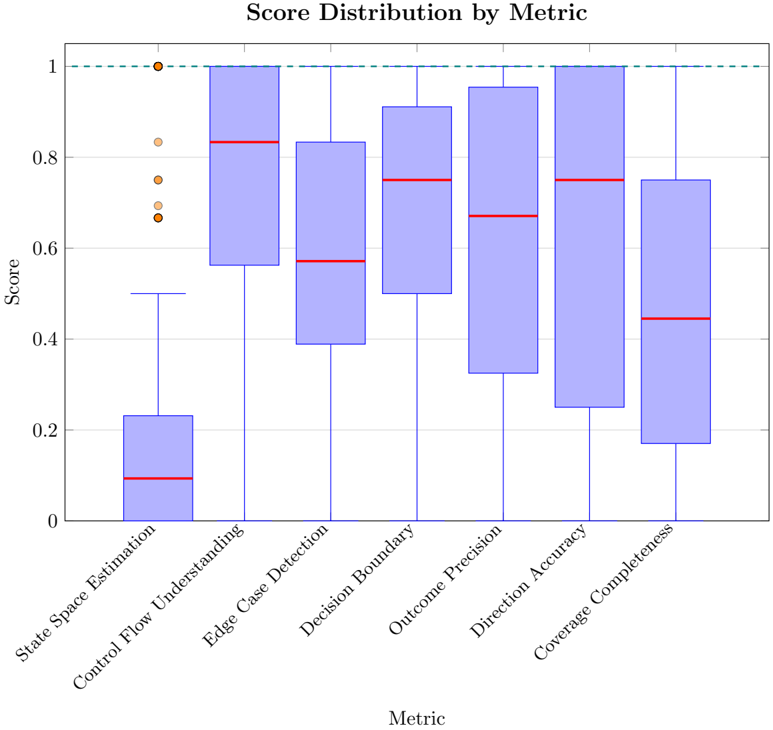
The image is a box plot illustrating the distribution of scores across various metrics. The plot displays the median, quartiles, and outliers for each metric, providing a visual comparison of their performance. A horizontal dashed line is present at the top of the chart at a score of 1.
### Components/Axes
* **Title:** Score Distribution by Metric
* **X-axis:** Metric, with the following categories:
* State Space Estimation
* Control Flow Understanding
* Edge Case Detection
* Decision Boundary
* Outcome Precision
* Direction Accuracy
* Coverage Completeness
* **Y-axis:** Score, ranging from 0 to 1, with tick marks at intervals of 0.2.
* **Box Plot Elements:** Each box plot represents the interquartile range (IQR), with a line indicating the median. Whiskers extend from the box to show the range of the data, and outliers are plotted as individual points.
* **Horizontal Line:** A dashed horizontal line is present at the score of 1.
### Detailed Analysis
Here's a breakdown of the score distribution for each metric:
* **State Space Estimation:**
* The box extends from approximately 0.0 to 0.25.
* The median is around 0.1.
* There are several outliers above the upper whisker, ranging from approximately 0.65 to 1.0.
* **Control Flow Understanding:**
* The box extends from approximately 0.6 to 1.0.
* The median is around 0.83.
* **Edge Case Detection:**
* The box extends from approximately 0.4 to 1.0.
* The median is around 0.57.
* **Decision Boundary:**
* The box extends from approximately 0.5 to 0.93.
* The median is around 0.76.
* **Outcome Precision:**
* The box extends from approximately 0.5 to 0.95.
* The median is around 0.68.
* **Direction Accuracy:**
* The box extends from approximately 0.75 to 1.0.
* The median is around 0.82.
* **Coverage Completeness:**
* The box extends from approximately 0.15 to 0.75.
* The median is around 0.44.
### Key Observations
* **State Space Estimation** has the lowest scores and the most outliers.
* **Control Flow Understanding, Direction Accuracy** have the highest median scores and less variance.
* **Coverage Completeness** has a wide interquartile range, indicating variability in scores.
### Interpretation
The box plot provides a comparative view of the performance of different metrics. State Space Estimation appears to be the weakest performing metric, with low scores and several outliers, suggesting inconsistent results. Control Flow Understanding and Direction Accuracy show consistently high scores. The wide interquartile range for Coverage Completeness suggests that the performance of this metric varies significantly. The horizontal line at a score of 1 may represent a target or ideal performance level.