## Box Plot Chart: Score Distribution by Metric
### Overview
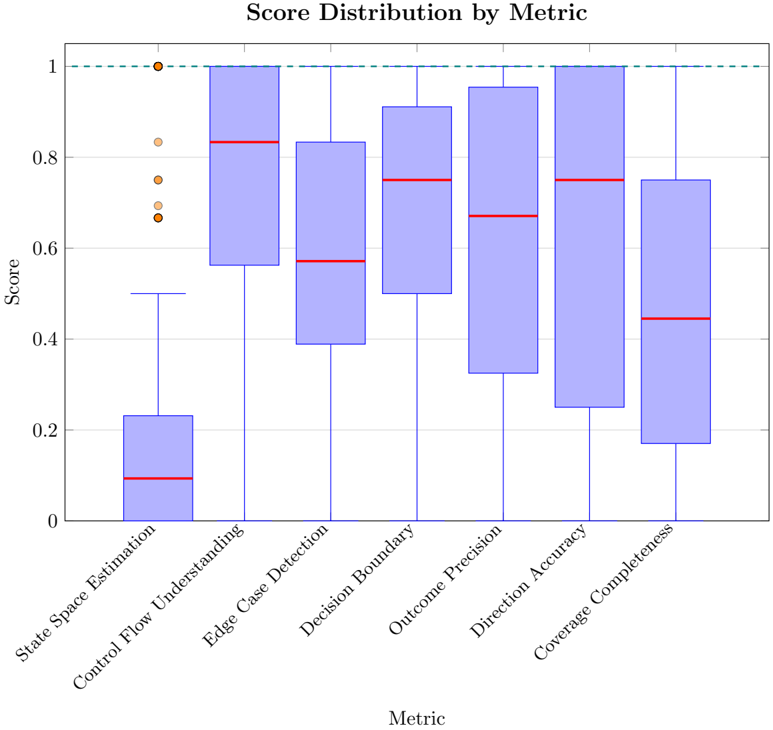
The image displays a box plot chart titled "Score Distribution by Metric." It visualizes the statistical distribution of scores (ranging from 0 to 1) across seven distinct performance metrics. The chart uses a standard box-and-whisker plot format to show the median, quartiles, range, and outliers for each metric.
### Components/Axes
* **Title:** "Score Distribution by Metric" (centered at the top).
* **Y-Axis:**
* **Label:** "Score" (rotated vertically on the left).
* **Scale:** Linear scale from 0 to 1, with major tick marks at 0, 0.2, 0.4, 0.6, 0.8, and 1.
* **Reference Line:** A horizontal dashed teal line at y=1.0, indicating a maximum possible or target score.
* **X-Axis:**
* **Label:** "Metric" (centered at the bottom).
* **Categories (from left to right):**
1. State Space Estimation
2. Control Flow Understanding
3. Edge Case Detection
4. Decision Boundary
5. Outcome Precision
6. Direction Accuracy
7. Coverage Completeness
* **Plot Elements:** Each metric has a corresponding box plot.
* **Box (Blue Fill):** Represents the interquartile range (IQR), from the 25th percentile (Q1) to the 75th percentile (Q3).
* **Median Line (Red):** A horizontal line within each box indicating the median (50th percentile) score.
* **Whiskers (Blue Lines):** Extend from the box to the minimum and maximum values within 1.5 * IQR from Q1 and Q3.
* **Outliers (Orange/Brown Circles):** Individual data points beyond the whisker range.
### Detailed Analysis
**Trend Verification & Spatial Grounding:** The chart is analyzed from left to right. The red median line's vertical position indicates the central tendency for each metric.
1. **State Space Estimation:**
* **Trend:** The distribution is heavily skewed toward low scores.
* **Values:** Median ≈ 0.10. Box (IQR) spans from ~0.0 to ~0.23. Lower whisker at 0. Upper whisker at ~0.50.
* **Outliers:** Four distinct outlier points are visible above the upper whisker, at approximately y=0.67, 0.70, 0.75, and 0.83. One outlier is at the maximum score of 1.0 (on the dashed line).
2. **Control Flow Understanding:**
* **Trend:** Shows the highest median and a distribution skewed toward high scores.
* **Values:** Median ≈ 0.83. Box (IQR) spans from ~0.56 to 1.0 (the top of the box aligns with the dashed line). Lower whisker extends down to ~0.0. No upper whisker is visible as the box reaches the maximum.
3. **Edge Case Detection:**
* **Trend:** Moderate median with a wide spread.
* **Values:** Median ≈ 0.57. Box (IQR) spans from ~0.39 to ~0.83. Whiskers extend from ~0.0 to 1.0.
4. **Decision Boundary:**
* **Trend:** Relatively high median and compact IQR compared to neighbors.
* **Values:** Median ≈ 0.75. Box (IQR) spans from ~0.50 to ~0.91. Whiskers extend from ~0.0 to 1.0.
5. **Outcome Precision:**
* **Trend:** Moderate median with a very wide overall range.
* **Values:** Median ≈ 0.67. Box (IQR) spans from ~0.32 to ~0.95. Whiskers extend from ~0.0 to 1.0.
6. **Direction Accuracy:**
* **Trend:** High median and a wide IQR, similar to Control Flow Understanding but with a lower Q1.
* **Values:** Median ≈ 0.75. Box (IQR) spans from ~0.25 to 1.0. Lower whisker extends to ~0.0. No upper whisker visible.
7. **Coverage Completeness:**
* **Trend:** The lowest median after State Space Estimation, with a wide spread.
* **Values:** Median ≈ 0.44. Box (IQR) spans from ~0.17 to ~0.75. Whiskers extend from ~0.0 to 1.0.
### Key Observations
* **Performance Disparity:** There is a stark contrast between metrics. "Control Flow Understanding" and "Direction Accuracy" show strong performance (high medians, boxes reaching the top), while "State Space Estimation" performs poorly (very low median).
* **Variability:** Most metrics ("Edge Case Detection," "Decision Boundary," "Outcome Precision," "Coverage Completeness") exhibit very high variability, with whiskers spanning the entire 0-1 range. This suggests inconsistent performance across different test cases or samples.
* **Outliers:** Only "State Space Estimation" shows visible outliers, all on the high end. This indicates that while the model generally fails at this task, there are a few instances where it achieves moderate to perfect scores.
* **Ceiling Effect:** The boxes for "Control Flow Understanding" and "Direction Accuracy" are capped at the maximum score of 1.0, indicating a significant portion of samples achieved perfect scores for these metrics.
### Interpretation
This chart likely evaluates the performance of an AI model, software system, or algorithm across different cognitive or operational dimensions. The data suggests the system has a very uneven skill profile.
* **Strengths:** The system demonstrates robust capabilities in understanding control flow and determining direction, as evidenced by high median scores and a concentration of results at the top of the scale.
* **Critical Weakness:** "State Space Estimation" is a clear failure point. The extremely low median and tight IQR at the bottom of the scale indicate a fundamental and consistent inability to perform this task, with only rare, anomalous successes (the outliers).
* **Inconsistency:** For most other metrics (e.g., Edge Case Detection, Outcome Precision), the system's performance is highly unpredictable, ranging from complete failure to perfect success. This could point to sensitivity to specific input conditions, lack of robustness, or that the metrics capture a broad range of difficulty levels.
* **Implication:** Development efforts should be prioritized on improving "State Space Estimation." The high variability in other areas warrants investigation into the causes of failure cases to improve reliability. The system appears to have mastered certain aspects (Control Flow, Direction) but lacks the foundational understanding required for others (State Space).