## Box Plot: Score Distribution by Metric
### Overview
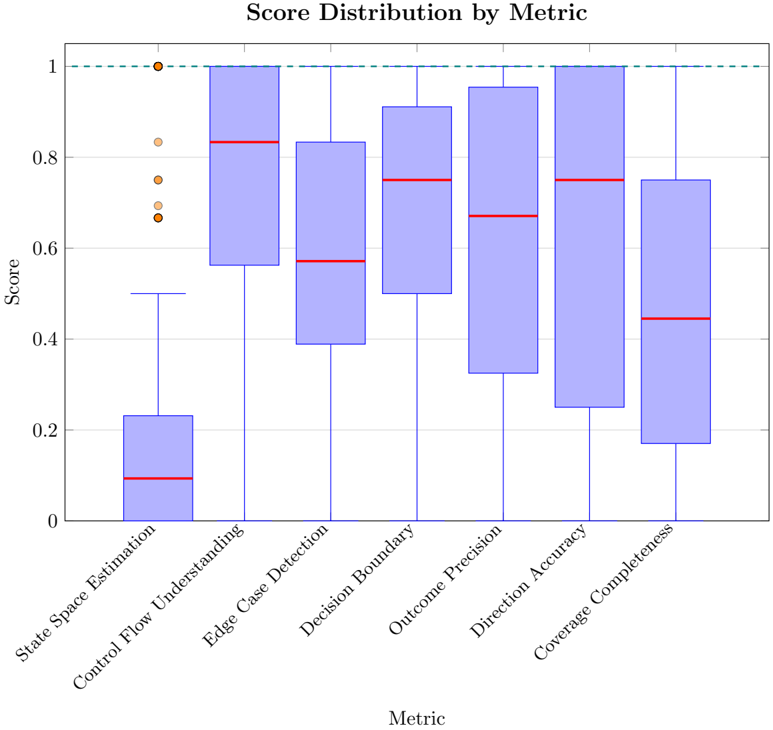
The image displays a box plot visualizing the distribution of scores across seven technical metrics. The y-axis represents scores ranging from 0 to 1, while the x-axis lists seven distinct metrics. Each metric is represented by a blue box plot with a red median line, and outliers are marked with orange and light orange dots. A horizontal dashed line at y=1 indicates a perfect score threshold.
### Components/Axes
- **X-Axis (Metrics)**:
1. State Space Estimation
2. Control Flow Understanding
3. Edge Case Detection
4. Decision Boundary
5. Outcome Precision
6. Direction Accuracy
7. Coverage Completeness
- **Y-Axis (Score)**:
- Scale: 0 to 1 (continuous)
- Labels: Numerical increments at 0.2, 0.4, 0.6, 0.8, 1.0
- **Legend**:
- Located at the top-right corner (position: top-right).
- Contains two entries:
- **Blue**: Box plots (likely representing interquartile ranges).
- **Red**: Median lines.
- *Note*: The legend does not explicitly define outlier markers (orange/light orange dots).
### Detailed Analysis
1. **State Space Estimation**:
- Median: ~0.1 (lowest among all metrics).
- Range: ~0.05 to ~0.5 (narrowest box plot).
- Outliers: Two orange dots at ~0.7 and ~0.8 (highest outliers in the dataset).
2. **Control Flow Understanding**:
- Median: ~0.8 (highest median).
- Range: ~0.6 to ~0.95.
- Outliers: None.
3. **Edge Case Detection**:
- Median: ~0.6.
- Range: ~0.4 to ~0.9.
- Outliers: One light orange dot at ~0.95.
4. **Decision Boundary**:
- Median: ~0.75.
- Range: ~0.5 to ~0.9.
- Outliers: None.
5. **Outcome Precision**:
- Median: ~0.7.
- Range: ~0.4 to ~0.95.
- Outliers: None.
6. **Direction Accuracy**:
- Median: ~0.75.
- Range: ~0.3 to ~1.0.
- Outliers: None.
7. **Coverage Completeness**:
- Median: ~0.45.
- Range: ~0.2 to ~0.8.
- Outliers: None.
### Key Observations
- **Highest Median**: Control Flow Understanding (~0.8) and Direction Accuracy (~0.75) show the strongest central tendencies.
- **Lowest Median**: State Space Estimation (~0.1) is significantly underperforming compared to others.
- **Widest Spread**: Direction Accuracy has the largest interquartile range (~0.3 to ~1.0), indicating high variability.
- **Outliers**:
- State Space Estimation has two high outliers (~0.7, ~0.8), suggesting rare exceptional cases.
- Edge Case Detection has one high outlier (~0.95).
- **Perfect Scores**: Two orange dots at y=1.0 (top of the plot) are present but not explicitly tied to specific metrics.
### Interpretation
The data suggests significant variability in performance across metrics. Control Flow Understanding and Direction Accuracy demonstrate robust central performance, while State Space Estimation struggles consistently. The presence of high outliers in State Space Estimation and Edge Case Detection implies that while most scores are low, there are rare instances of exceptional performance. The lack of a clear legend for outlier markers leaves ambiguity about their significance (e.g., whether they represent errors, edge cases, or data anomalies). The perfect score threshold (y=1.0) is unattained by any metric’s median, highlighting room for improvement across all categories.