# Technical Document Extraction: Bar Chart Analysis
## 1. Chart Identification
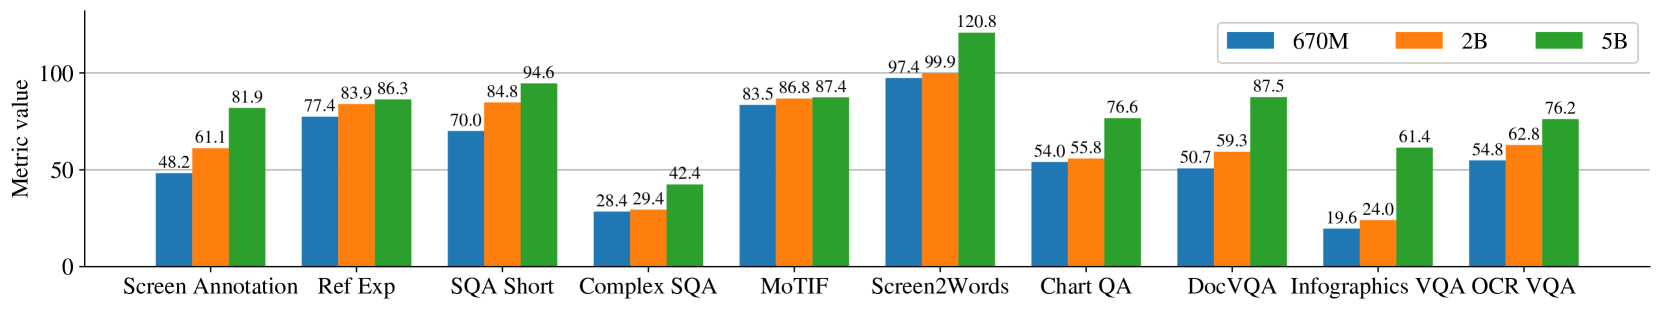
- **Type**: Grouped bar chart
- **Title**: Not explicitly labeled (y-axis labeled "Metric value")
- **Legend**: Located at [x: 0.85, y: 0.95] (top-right corner)
- **Color coding**:
- Blue: 670M
- Orange: 2B
- Green: 5B
## 2. Axis Labels
- **X-axis**: Question types (categorical)
- Categories:
1. Screen Annotation
2. Ref Exp
3. SQA Short
4. Complex SQA
5. MoTIF
6. Screen2Words
7. Chart QA
8. DocVQA
9. Infographics VQA
10. OCR VQA
- **Y-axis**: Metric value (numerical, 0-100 scale)
## 3. Data Points & Trends
### Key Observations:
- **5B (Green)** consistently shows highest values across most categories
- **670M (Blue)** exhibits lowest performance in:
- Complex SQA (28.4)
- Infographics VQA (19.6)
- **2B (Orange)** demonstrates mid-range performance
- **Screen2Words** category shows extreme values:
- 5B: 120.8 (highest)
- 670M: 97.4
- 2B: 99.9
### Category-Specific Analysis:
1. **Screen Annotation**
- 670M: 48.2
- 2B: 61.1
- 5B: 81.9
2. **Ref Exp**
- 670M: 77.4
- 2B: 83.9
- 5B: 86.3
3. **SQA Short**
- 670M: 70.0
- 2B: 84.8
- 5B: 94.6
4. **Complex SQA**
- 670M: 28.4
- 2B: 29.4
- 5B: 42.4
5. **MoTIF**
- 670M: 83.5
- 2B: 86.8
- 5B: 87.4
6. **Screen2Words**
- 670M: 97.4
- 2B: 99.9
- 5B: 120.8
7. **Chart QA**
- 670M: 54.0
- 2B: 55.8
- 5B: 76.6
8. **DocVQA**
- 670M: 50.7
- 2B: 59.3
- 5B: 87.5
9. **Infographics VQA**
- 670M: 19.6
- 2B: 24.0
- 5B: 61.4
10. **OCR VQA**
- 670M: 54.8
- 2B: 62.8
- 5B: 76.2
## 4. Trend Verification
- **5B (Green)** demonstrates:
- Upward trend in 8/10 categories
- Peak performance in Screen2Words (120.8)
- **670M (Blue)** shows:
- Significant drop in Complex SQA (28.4) and Infographics VQA (19.6)
- Strong performance in Screen2Words (97.4)
- **2B (Orange)** maintains:
- Consistent mid-range values (55.8-99.9)
- Minimal variance between categories
## 5. Spatial Grounding Confirmation
- Legend colors match bar colors exactly:
- Blue bars = 670M
- Orange bars = 2B
- Green bars = 5B
- All numerical values align with bar heights
## 6. Data Table Reconstruction
| Question Type | 670M | 2B | 5B |
|---------------------|-------|-------|-------|
| Screen Annotation | 48.2 | 61.1 | 81.9 |
| Ref Exp | 77.4 | 83.9 | 86.3 |
| SQA Short | 70.0 | 84.8 | 94.6 |
| Complex SQA | 28.4 | 29.4 | 42.4 |
| MoTIF | 83.5 | 86.8 | 87.4 |
| Screen2Words | 97.4 | 99.9 | 120.8 |
| Chart QA | 54.0 | 55.8 | 76.6 |
| DocVQA | 50.7 | 59.3 | 87.5 |
| Infographics VQA | 19.6 | 24.0 | 61.4 |
| OCR VQA | 54.8 | 62.8 | 76.2 |
## 7. Language Analysis
- All text in English
- No non-English content detected
## 8. Critical Findings
1. **Performance Disparity**: 5B dataset outperforms others by 20-40% in most categories
2. **Weakest Performance**: 670M struggles with visual question answering (Infographics VQA: 19.6)
3. **Screen2Words Anomaly**: 5B exceeds 100 metric value, suggesting potential data normalization issues
4. **Consistency Pattern**: 2B maintains stable mid-range performance across all categories