TECHNICAL ASSET FINGERPRINT
1d7c4d858cfeeb1d38f401c5
Click to view fullscreen
Press ESC or click to close
FOUND IN PAPERS
EXPERT: healer-alpha-free VERSION 1
RUNTIME: free/openrouter/healer-alpha
INTEL_VERIFIED
\n
## Stacked Bar Chart: Build Duration Comparison Across Software Projects
### Overview
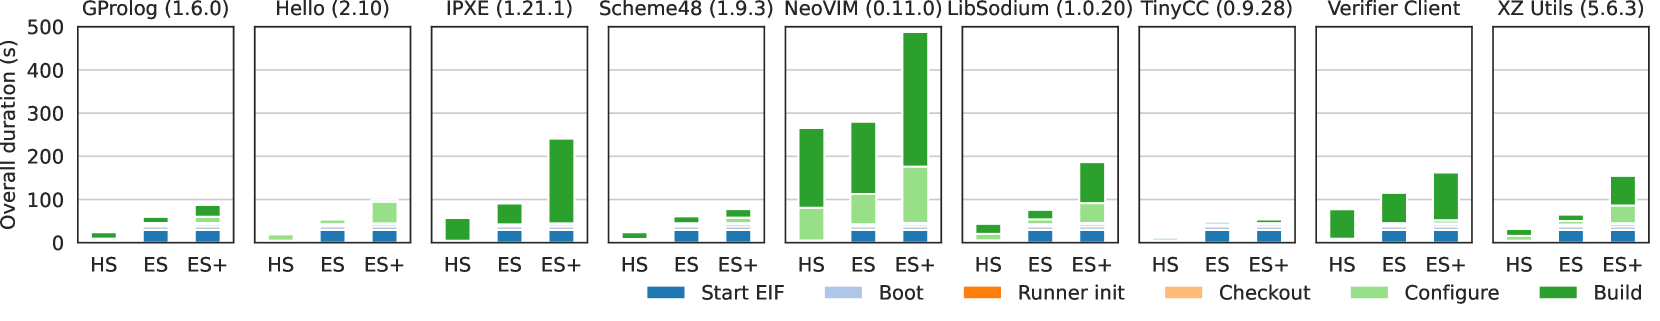
The image displays a series of nine stacked bar charts arranged horizontally. Each chart compares the overall build duration (in seconds) for a specific software project under three different configurations or environments labeled "HS", "ES", and "ES+". The charts collectively analyze the performance impact of these configurations across a diverse set of software.
### Components/Axes
* **Main Title (Implicit):** The overall figure compares build durations. Each subplot has a specific title.
* **Subplot Titles (Top of each chart, from left to right):**
1. GProlog (1.6.0)
2. Hello (2.10)
3. IPXE (1.21.1)
4. Scheme48 (1.9.3)
5. NeoVIM (0.11.0)
6. LibSodium (1.0.20)
7. TinyCC (0.9.28)
8. Verifier Client
9. XZ Utils (5.6.3)
* **Y-Axis (Leftmost chart only):** Label: "Overall duration (s)". Scale: 0 to 500, with major tick marks at 0, 100, 200, 300, 400, 500.
* **X-Axis (Each subplot):** Three categorical labels: "HS", "ES", "ES+".
* **Legend (Bottom center of the entire figure):** Six color-coded categories representing components of the total duration:
* **Start EIF:** Dark Blue
* **Boot:** Light Blue
* **Runner init:** Orange
* **Checkout:** Light Orange
* **Configure:** Light Green
* **Build:** Dark Green
### Detailed Analysis
The data is presented as stacked bars. The total height of each bar represents the "Overall duration". The colored segments within each bar represent the time spent on the six components defined in the legend. The "Build" (dark green) component is consistently the largest or one of the largest segments across all projects and configurations.
**Per-Project Analysis (Approximate values, read from the chart):**
1. **GProlog (1.6.0):**
* **HS:** Very low total duration (~20s). Primarily "Build" (dark green).
* **ES:** Increased total (~60s). Visible segments: "Boot" (light blue, ~20s), "Configure" (light green, ~10s), "Build" (dark green, ~30s).
* **ES+:** Slightly higher than ES (~80s). Similar segment distribution to ES.
2. **Hello (2.10):**
* **HS:** Very low total (~15s). Mostly "Build".
* **ES:** Total ~50s. "Boot" (~20s), "Configure" (~10s), "Build" (~20s).
* **ES+:** Highest total (~90s). "Boot" (~20s), "Configure" (~30s), "Build" (~40s).
3. **IPXE (1.21.1):**
* **HS:** Moderate total (~55s). Almost entirely "Build".
* **ES:** Higher total (~90s). "Boot" (~20s), "Build" (~70s).
* **ES+:** Significantly higher total (~240s). "Boot" (~20s), "Configure" (~20s), "Build" (~200s).
4. **Scheme48 (1.9.3):**
* **HS:** Low total (~20s). Mostly "Build".
* **ES:** Total ~60s. "Boot" (~20s), "Configure" (~10s), "Build" (~30s).
* **ES+:** Total ~75s. "Boot" (~20s), "Configure" (~15s), "Build" (~40s).
5. **NeoVIM (0.11.0):**
* **HS:** High total (~260s). "Configure" (~80s), "Build" (~180s).
* **ES:** Higher total (~280s). "Boot" (~20s), "Configure" (~80s), "Build" (~180s).
* **ES+:** Very high total (~490s). "Boot" (~20s), "Configure" (~160s), "Build" (~310s).
6. **LibSodium (1.0.20):**
* **HS:** Low total (~40s). Mostly "Build".
* **ES:** Total ~70s. "Boot" (~20s), "Configure" (~10s), "Build" (~40s).
* **ES+:** Higher total (~185s). "Boot" (~20s), "Configure" (~60s), "Build" (~105s).
7. **TinyCC (0.9.28):**
* **HS:** Very low total (~10s). Mostly "Build".
* **ES:** Low total (~45s). "Boot" (~20s), "Configure" (~10s), "Build" (~15s).
* **ES+:** Slightly higher total (~55s). "Boot" (~20s), "Configure" (~15s), "Build" (~20s).
8. **Verifier Client:**
* **HS:** Moderate total (~80s). Almost entirely "Build".
* **ES:** Higher total (~110s). "Boot" (~20s), "Build" (~90s).
* **ES+:** Highest total (~160s). "Boot" (~20s), "Configure" (~20s), "Build" (~120s).
9. **XZ Utils (5.6.3):**
* **HS:** Low total (~30s). Mostly "Build".
* **ES:** Total ~60s. "Boot" (~20s), "Configure" (~10s), "Build" (~30s).
* **ES+:** Higher total (~155s). "Boot" (~20s), "Configure" (~60s), "Build" (~75s).
### Key Observations
1. **Consistent Trend:** For every single software project, the total duration increases from HS to ES, and again from ES to ES+. The ES+ configuration is always the slowest.
2. **Dominant Component:** The "Build" (dark green) phase is the primary contributor to total duration in nearly all cases, especially for HS configurations.
3. **Emergence of "Configure":** The "Configure" (light green) component becomes significantly more prominent in the ES and ES+ configurations for many projects (e.g., NeoVIM, LibSodium, XZ Utils, IPXE).
4. **Stable "Boot" Time:** The "Boot" (light blue) component appears to have a relatively constant duration (~20s) across all projects and configurations where it is visible (ES and ES+).
5. **Project Variability:** The absolute scale of duration varies greatly. NeoVIM is an order of magnitude slower than TinyCC. The impact of moving to ES+ is most dramatic for IPXE and NeoVIM in absolute terms.
### Interpretation
This chart demonstrates the performance overhead associated with different execution environments (HS, ES, ES+) for building software. The data suggests:
* **HS (likely "Host System" or similar)** is the baseline, fastest configuration, relying almost entirely on the native "Build" process.
* **ES (likely "Execution Environment" or "Emulated System")** introduces consistent overhead, primarily from a "Boot" phase and an increased "Configure" phase, leading to a moderate increase in total build time.
* **ES+ (an enhanced or more isolated ES)** adds substantial overhead, most notably a dramatically expanded "Configure" phase and often a larger "Build" phase. This could indicate more complex environment setup, additional security checks, or less optimized code paths in this configuration.
* The **"Build" phase itself scales poorly** in the ES+ environment for complex projects like NeoVIM and IPXE, suggesting that the environment's constraints significantly impact the core compilation task.
* The **consistency of the "Boot" time** suggests it's a fixed-cost operation for the ES/ES+ environments, independent of the software being built.
The investigation reveals a clear trade-off: the ES/ES+ environments (which may offer benefits like security, isolation, or reproducibility) come at a significant and variable cost in build performance, primarily driven by configuration and build-time inflation. Project complexity (e.g., NeoVIM vs. Hello) is a major factor in how severely this overhead is felt.
DECODING INTELLIGENCE...