## Line Chart: Gemini-2.0-Flash
### Overview
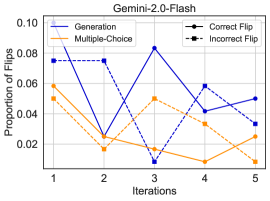
The image is a line chart titled "Gemini-2.0-Flash" that displays the proportion of flips across five iterations for different categories: Generation, Multiple-Choice, Correct Flip, and Incorrect Flip. The chart uses different line styles and colors to distinguish between these categories.
### Components/Axes
* **Title:** Gemini-2.0-Flash
* **X-axis:** Iterations, labeled from 1 to 5.
* **Y-axis:** Proportion of Flips, ranging from 0.00 to 0.10, with increments of 0.02.
* **Legend:** Located in the top-left and top-right corners of the chart.
* **Generation:** Solid navy blue line.
* **Multiple-Choice:** Solid orange line.
* **Correct Flip:** Solid black line with circle markers.
* **Incorrect Flip:** Dashed black line with square markers.
### Detailed Analysis
* **Generation (Solid Navy Blue Line):**
* Trend: Fluctuates across iterations.
* Iteration 1: Approximately 0.075
* Iteration 2: Approximately 0.075
* Iteration 3: Approximately 0.01
* Iteration 4: Approximately 0.042
* Iteration 5: Approximately 0.05
* **Multiple-Choice (Solid Orange Line):**
* Trend: Decreases initially, then fluctuates.
* Iteration 1: Approximately 0.058
* Iteration 2: Approximately 0.022
* Iteration 3: Approximately 0.05
* Iteration 4: Approximately 0.008
* Iteration 5: Approximately 0.028
* **Correct Flip (Solid Black Line with Circle Markers):**
* Trend: Increases, peaks at iteration 3, then decreases.
* Iteration 1: Approximately 0.075
* Iteration 2: Approximately 0.025
* Iteration 3: Approximately 0.084
* Iteration 4: Approximately 0.04
* Iteration 5: Approximately 0.032
* **Incorrect Flip (Dashed Black Line with Square Markers):**
* Trend: Decreases, then increases, then decreases.
* Iteration 1: Approximately 0.05
* Iteration 2: Approximately 0.075
* Iteration 3: Approximately 0.015
* Iteration 4: Approximately 0.058
* Iteration 5: Approximately 0.032
### Key Observations
* The "Generation" and "Correct Flip" lines show similar trends, with peaks and valleys at similar iteration points.
* The "Multiple-Choice" line generally decreases over the iterations.
* The "Incorrect Flip" line has a notable peak at iteration 2.
* The proportion of flips varies significantly across iterations for all categories.
### Interpretation
The chart illustrates how the proportion of flips changes across iterations for different methods or categories within the "Gemini-2.0-Flash" system. The fluctuations suggest that the system's behavior varies with each iteration. The "Generation" and "Correct Flip" lines moving in tandem could indicate a relationship between these two categories. The decreasing trend of "Multiple-Choice" might suggest that this method becomes less prone to flips as iterations progress. The peak in "Incorrect Flip" at iteration 2 could indicate a specific issue or change in the system at that point. Further analysis would be needed to understand the underlying causes of these trends and their implications for the system's performance.